plotAddTSHF
Purpose
Adds high-frequency and irregularly spaced time series data to an already existing plot.
Format
-
plotAddTSHF([myPlot, ]date_vec, y)¶ - Parameters:
myPlot (Struct) – Optional argument, a
plotControlstructure.date_vec (Nx1 vector) –
containing the dates for each observation in the y . The dates in date_vec are required to be:
In POSIX time/date format i.e. seconds since Jan 1, 1970 (GAUSS dataframe date columns are automatically in this format).
Sorted, increasing.
However, the dates in date_vec may be:
Irregularly spaced
y (Nx1 or NxM matrix) – Each column contains the Y values for a particular line.
Examples
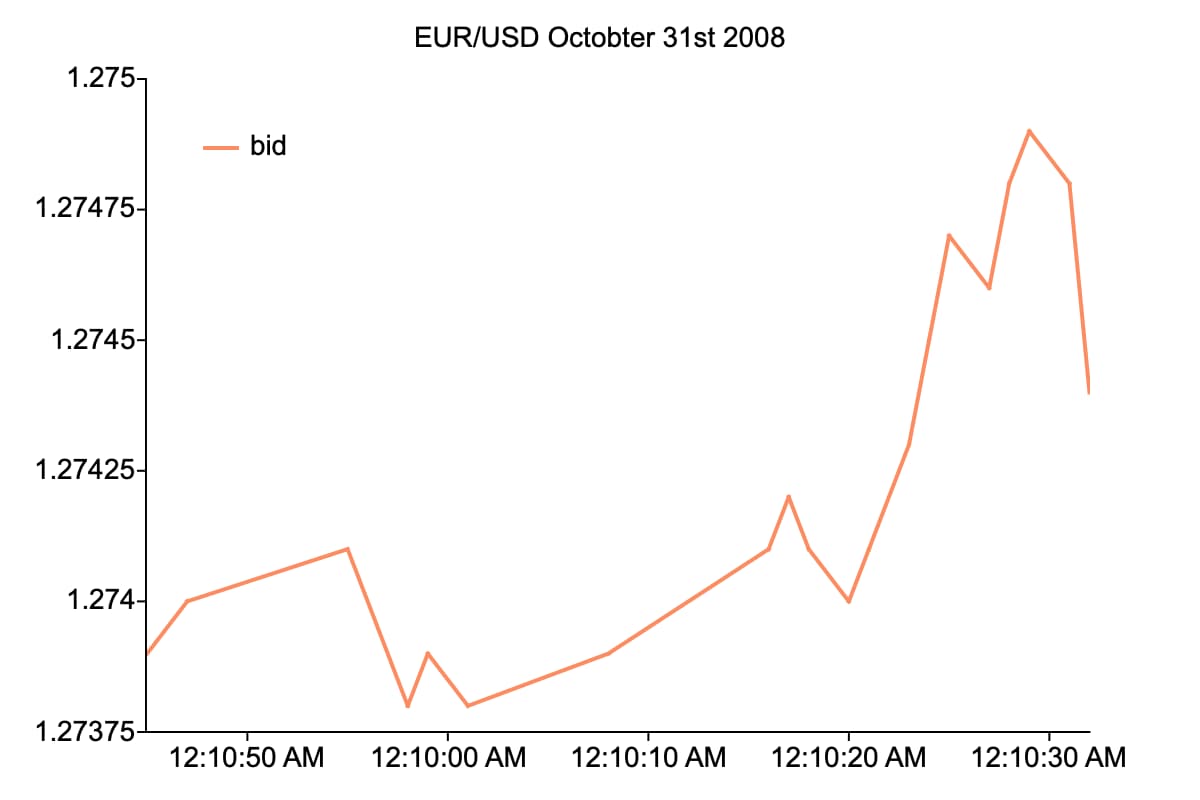
Plot Forex tick data with custom X-tick labels
// Create file name with full path
file = getGAUSSHome("examples/eurusd_tick.csv");

// Load dates as a string array from the first column of the file
dt_psx = loadd(file, "date");

// Use first 20 obs only
dt_psx = dt_psx[1:20];

// Load bid and ask data
y = loadd(file, "bid + ask");
y = y[1:rows(dt_psx), .];

// Set the size of the graph
plotCanvasSize("px", 600 | 400);

// Declare plotControl structure
// and fill with default settings
struct plotControl myPlot;
myPlot = plotGetDefaults("xy");

plotSetFonts(&myPlot, "all", "arial", 14);

plotSetTitle(&myPlot, "EUR/USD Octobter 31st 2008");

// Set legend text
plotSetLegend(&myPlot, "bid" $| "ask", "top left inside");

// Make legend background transparent
plotSetLegendBkd(&myPlot, 0);

// Create an X-tick label every 10 seconds
// Set the first tick label at:
// October 31st, 2008 at 51 minutes and 50 seconds after midnight
first_label = asdate("2008-10-31 12:51:50");
plotSetXTicInterval(&myPlot, 10, first_label, "seconds");

// Set the format for the tick label.
// You can add literal text like AM, by
// enclosing it in single-ticks
plotSetXTicLabel(&myplot, "HH:MM:SS 'AM'");

// Draw bids on graph
plotTSHF(myPlot, dt_psx, "seconds", y[ ., "bid"]);
The above code will produce:
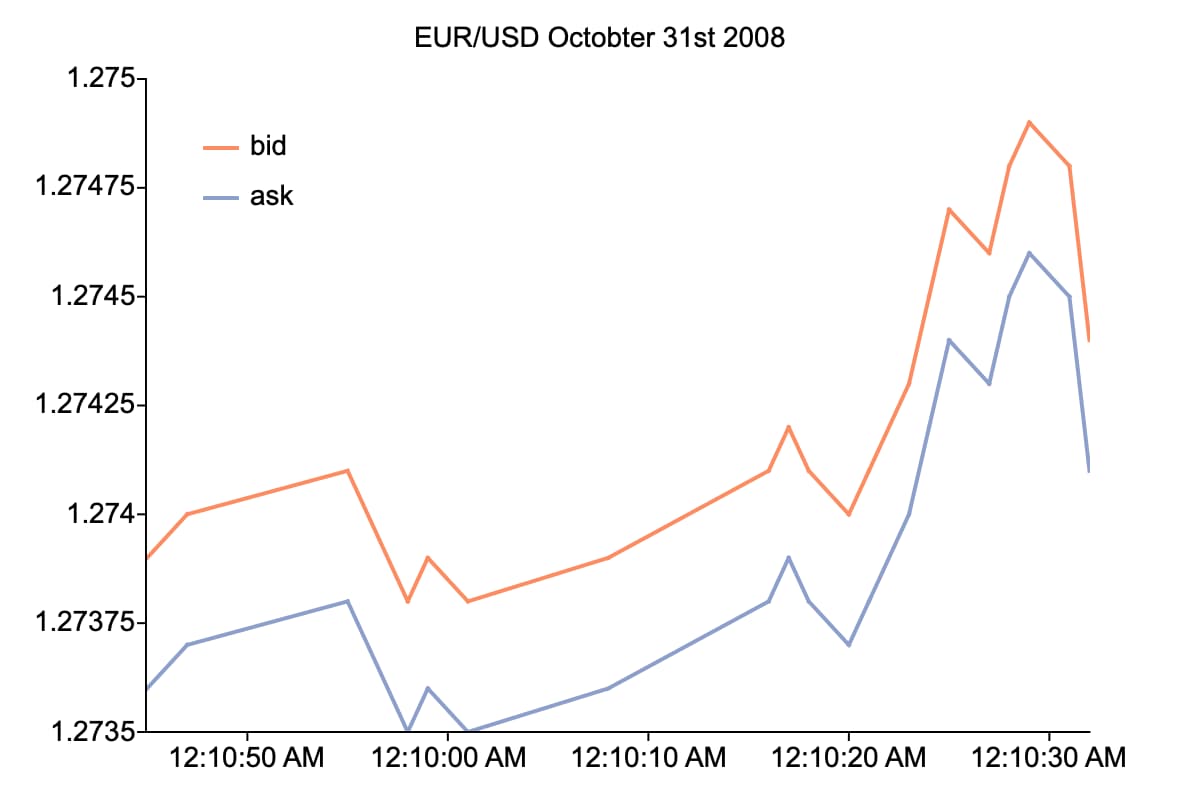
// Add asks on graph
plotAddTSHF(dt_psx, y[., "ask"]);
The above code will add the ask data. Notice that it is added to the legend which we set up before the initial graph.
Remarks
By default missing values in the y variable will be represented as gaps in the line.
See also
Functions plotTSHF(), plotSetXTicLabel(), plotSetXTicInterval(), plotScatter(), plotTS(), plotTSLog()