plotSetBar
Purpose
Sets the fill style and format of bars in a histogram or bar graph.
Format
-
plotSetBar(&myPlot, fillType, barStacked)¶ - Parameters:
&myPlot (struct pointer) – A
plotControlstructure pointer.fillType (Nx1 vector) –
where N is the number of bar styles to set.
0
Solid, beveled edge
1
Solid
2
Dense 1
3
Dense 2
4
Dense 3
5
Dense 4
6
Dense 5
7
Dense 6
8
Horizontal lines
9
Vertical lines
10
Cross pattern
11
B diagonal pattern
12
F diagonal pattern
13
Diagonal Cross
barStacked (Scalar) – 1 for stacked or 0 for side-by-side bars.
Examples
// Declare plotControl structure
struct plotControl myPlot;
// Initialize plotControl structure
myPlot = plotGetDefaults("bar");
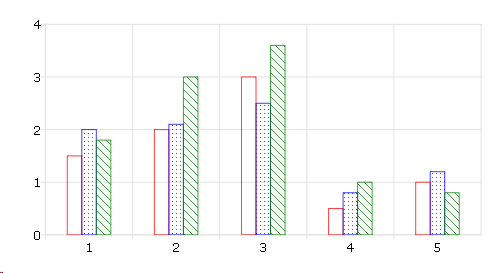
// Set the first set of bars to have a solid-fill, the
// second set to have a fill of horizontal lines, the third
// to have a diagonal cross fill and set the bars to be
// side-by-side.
textures = { 0, 8, 13 };
plotSetBar(&myPlot, textures, 0);
// Create data
x = seqa(1, 1, 5);
y = { 1.5 2 1.8,
2 2.1 3,
3 2.5 3.6,
0.5 0.8 1,
1 1.2 0.8 };
// Draw bar graph
plotBar(myPlot, x, y);
Remarks
When graphing without the use of a plotControl structure, these settings
may be chosen by selecting from the main menu.
See also
Functions plotBar(), plotGetDefaults(), plotHist()