plotSetYTicLabelFont#
Purpose#
Controls the settings for font style, size, and color of the y-axis tick labels on a graph.
Format#
- plotSetYTicLabelFontLabel(&myPlot, font[, fontSize[, fontColor]])#
- Parameters:
&myPlot (struct pointer) – A
plotControlstructure pointer.font (string) – Font or font family name.
fontSize (scalar) – Optional argument, font size in points.
fontColor (string) – Optional argument, named color or RGB value.
Examples#
// Declare plotControl structure
struct plotControl myPlot;
// Initialize plotControl structure
myPlot = plotGetDefaults("hist");
// Set the y-axis label font, label font size, and
// label color
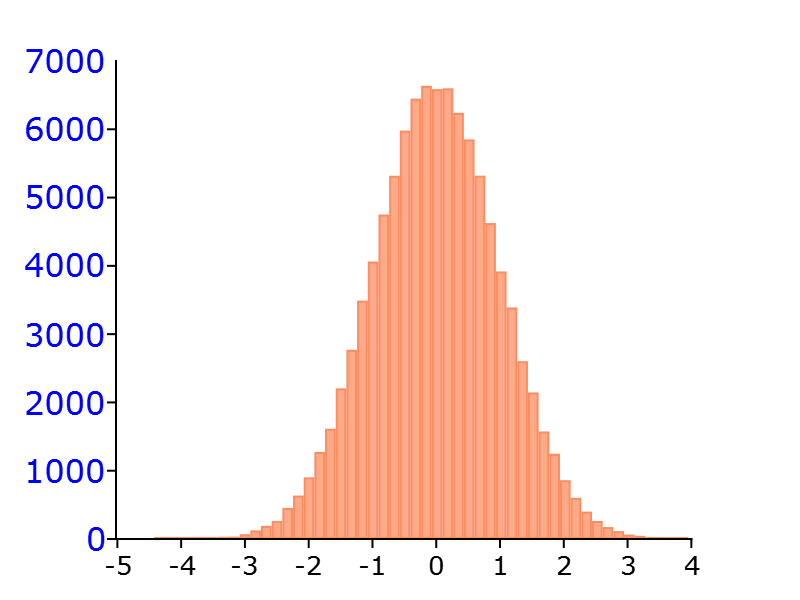
plotSetYTicLabelFont(&myPlot, "Arial", 12, "blue");
// Create data
x = rndn(1e5,1);
// Plot a histogram of the x data spread over 50 bins
plotHist(myPlot, x, 50);
Remarks#
Note
This function sets an attribute in a plotControl structure. It does not
affect an existing graph, or a new graph drawn using the default
settings that are accessible from the
menu.
See also
Functions plotsetactivex(), plotSetXTicInterval(), plotSetXTicLabel(), plotSetYLabel(), plotSetZLabel(), plotSetLinePen()