plotSetLinePen#
Purpose#
Sets the color, thickness and style for the lines on an XY or contour plot.
Format#
- plotSetLinePen(&myPlot, thickness[, clr[, style]])#
- Parameters:
&myPlot (struct pointer) – A
plotControlstructure pointer.thickness (Scalar or Nx1 matrix) – the thickness of the line(s) in pixels.
clr (string or Nx1 string array) – Optional argument, name or RGB value of the new color(s) for the line(s).
style (Scalar, Nx1 matrix, string, or Nx1 string array) –
Optional argument, the style(s) of the pen for the line(s). Options include:
1
solidSolid line.
2
dashDash line.
3
dotDot line.
4
dashdotDash-Dot line.
5
dashdotdotDash-Dot-Dot line.
Examples#
Basic example#
// Declare plotControl structure
struct plotControl myPlot;

// Initialize plotControl structure
myPlot = plotGetDefaults("xy");

// Set lines to be 2 pixels wide. Set
// the first line to be black and the second to be gray
plotSetLinePen(&myPlot, 2, "black" $| "gray");

// Create data
x = seqa(0.1, 0.1, 50);
y = sin(x) ~ cos(x);

// Plot the data with the new line colors
plotXY(myPlot, x, y);
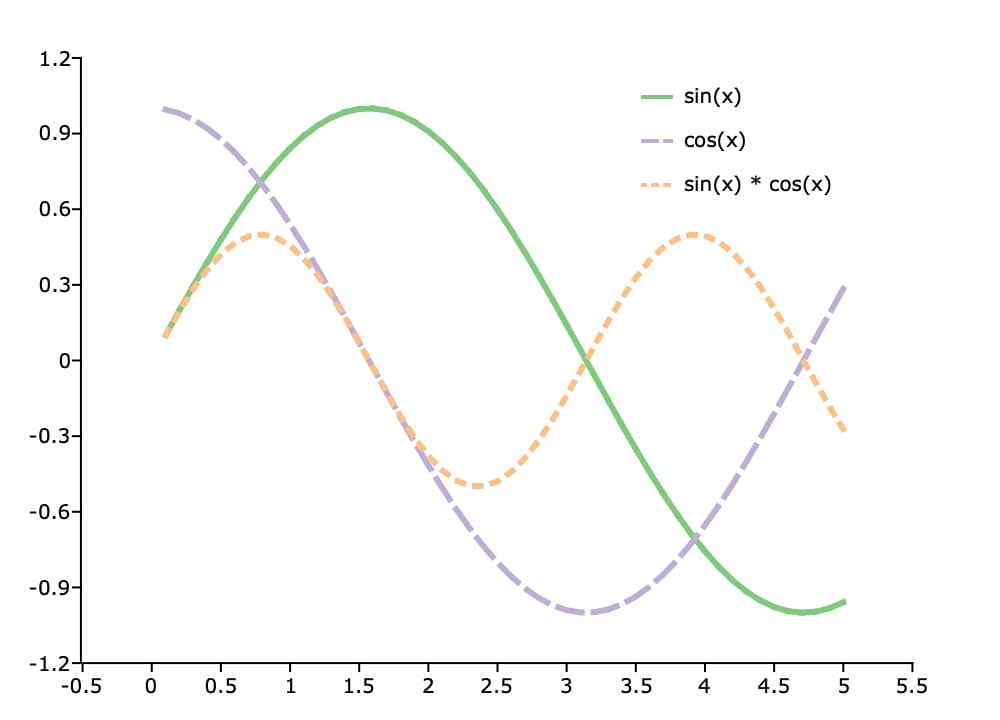
Example setting all options#
// Declare plotControl structure
// and fill with default settings
struct plotControl myPlot;
myPlot = plotGetDefaults("xy");


/*
** Set XY lines to
** 1. Be 2 pixels wide.
** 2. Use the colors from the 'accent' color palette
** 3. Set the line styles to be solid, dash, dot
*/
clrs = getColorPalette("accent");
styles = "solid" $| "dash" $| "dot";
plotSetLinePen(&myPlot, 2, clrs, styles);

// Create 3 series of data
x = seqa(0.1, 0.1, 50);
y = sin(x) ~ cos(x) ~ (sin(x) .* cos(x));

labels = "sin(x)" $| "cos(x)" $| "sin(x) * cos(x)";
plotSetLegend(&myPlot, labels);

// Plot the data with the new line
// colors, styles and thickness
plotXY(myPlot, x, y);
Remarks#
Note
This function sets an attribute in a plotControl structure. It does not
affect an existing graph, or a new graph drawn using the default
settings that are accessible from the
menu.
See also
Functions plotGetDefaults(), plotSetLineStyle(), plotSetXPen(), plotSetYPen()