plotSetMissGap#
Purpose#
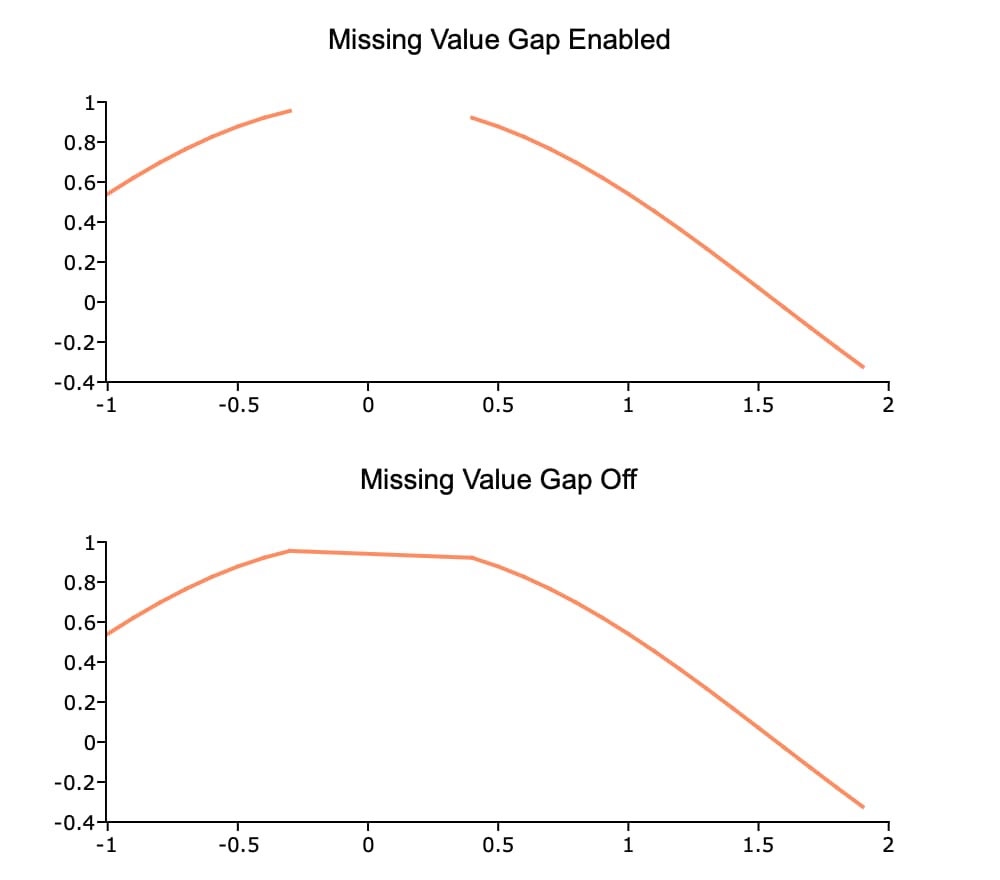
Controls whether missing data creates a gap in line plots, or is ignored.
Format#
- plotSetMissGap(&myPlot, is_on)#
- Parameters:
&myPlot (struct pointer) – A
plotControlstructure pointer.is_on (Scalar, or string) – A setting of 1 or
"on"will cause gaps at missing values. 0 or"off"will cause line plots to ignore elements with missing values.
Examples#
x = seqa(-1, 0.1, 30);
y = cos(x);

// Set the 9th to 14th elements
// of 'y' to be a missing value
y[9:14] = miss(0,0);

// Declare plotControl structure
// and fill with default settings
struct plotControl plt;
plt = plotGetDefaults("xy");

plotSetTitle(&plt, "Missing Value Gap Enabled", "Arial", 14);

// Create 2x1 graph layout and place
// the first graph in the first location
plotLayout(2, 1, 1);

// Draw the first plot
plotXY(plt, x, y);

// Place the next plot in the second location
plotLayout(2, 1, 2);

plotSetTitle(&plt, "Missing Value Gap Off");

// Turn off the missing gap
plotSetMissGap(&plt, "off");

// Draw second plot
plotXY(plt, x, y);
Remarks#
plotSetMissGap()will draw a straight line between the point before and after the missing value.
Note
This function sets an attribute in a plotControl structure. It does not
affect an existing graph, or a new graph drawn using the default
settings that are accessible from the
menu.