plotAddSurface#
Purpose#
Add a surface plot to an existing plot.
Format#
- plotAddSurface([myPlot, ]x, y, z)#
- Parameters:
myPlot (struct) – Optional argument. A
plotControlstructure.x (1xK vector) – the x-axis data.
y (Nx1 vector) – the y-axis data.
z (NxK matrix) – the matrix of height data to be plotted.
Examples#
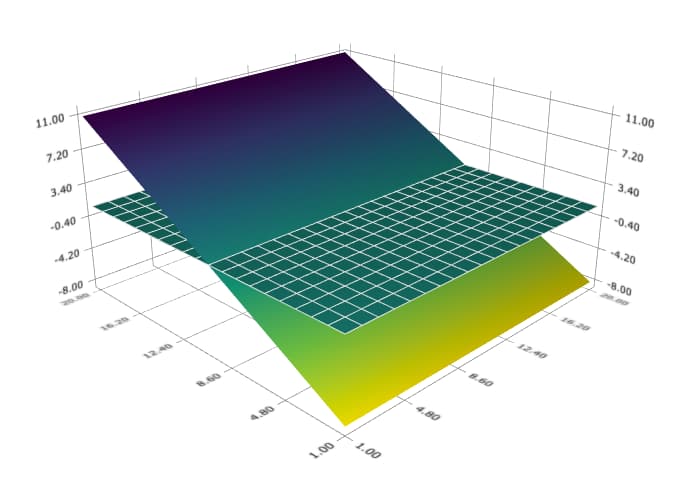
Basic case with default settings#
new;
cls;

// n: Number of observation
n = 20;

// First Surface
x = seqa(1, 1, n)';
z = ones(n,n);

// Plot surface
plotSurface(x, x', z);

// Second Surface
z2 = reshape(seqa(-8, 1, n), n, n);

// Plot the second surface
plotAddSurface(x, x', z2');
The plot is
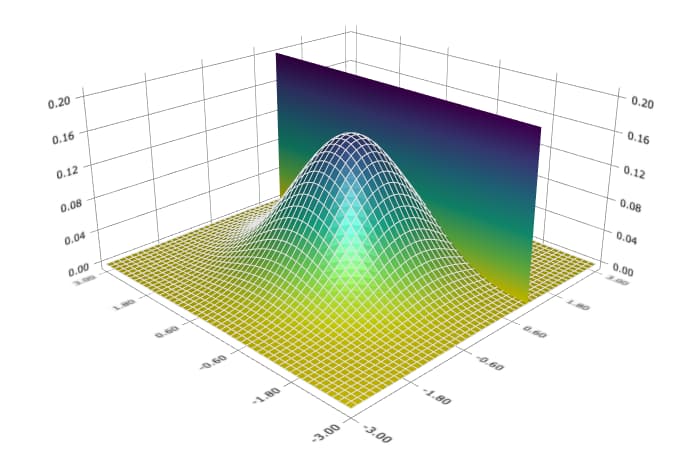
With a plotControl structure and color map#
new;
cls;

// n: Number of observation
n = 50;

// x: n * 1 vector from -3 to +3
x = seqa(-3, 6/(n-1), n);

// y: 1 * n row vector
y = x';

// z: Joint probability of 'x' and 'y'
z = pdfn(x) .* pdfn(y);

// Define plotControl structure
struct plotcontrol myPlot;
myPlot = plotGetDefaults("surface");

// Set a color map
plotSetColormap(&myPlot, "viridis");

// Plot bivariate normal distribution
plotSurface(myPlot, y, x, z);

// Add a plane with the following 4 corners: (x,y,z)
// (1, -3, 0),   (1, 3, 0)
// (1, -3, 0.2), (1, 3, 0.2)
x_plane = 1 ~ 1;
y_plane = -3 | 3;
z_plane = { 0 0.2,
            0 0.2 };

// Add plane
plotAddSurface(x_plane, y_plane, z_plane);
The plot is
Remarks#
If a plotControl structure is passed in to plotAddSurface(), the only
settings that will be checked are:
The extent of the x, y and z axes (which may be expanded by the
plotControlstructure).The instructions for turning the wireframe on or off for the surface being added.
See also
Functions plotSurface()