plotAddVBar#
Purpose#
Adds one or more vertical bars spanning the full extent of the y-axis to an existing graph.
Format#
- plotAddVBar([myPlot, ]x_start, x_end)#
- plotAddVBar([myPlot, ]x_loc)
- Parameters:
myPlot (struct) – Optional argument, an instance of a
plotControlstructure.x_start (scalar or Nx1 vector) – the X coordinate for the start of the bounding box for each respective shape.
x_end (scalar or Nx1 vector) – the X coordinate for the end of the bounding box for each respective shape.
x_loc (Nx2 vector) – the first column should contain X coordinates. The second column should be a binary vector with a 1 for locations which the bar should be drawn, otherwise a 0.
Examples#
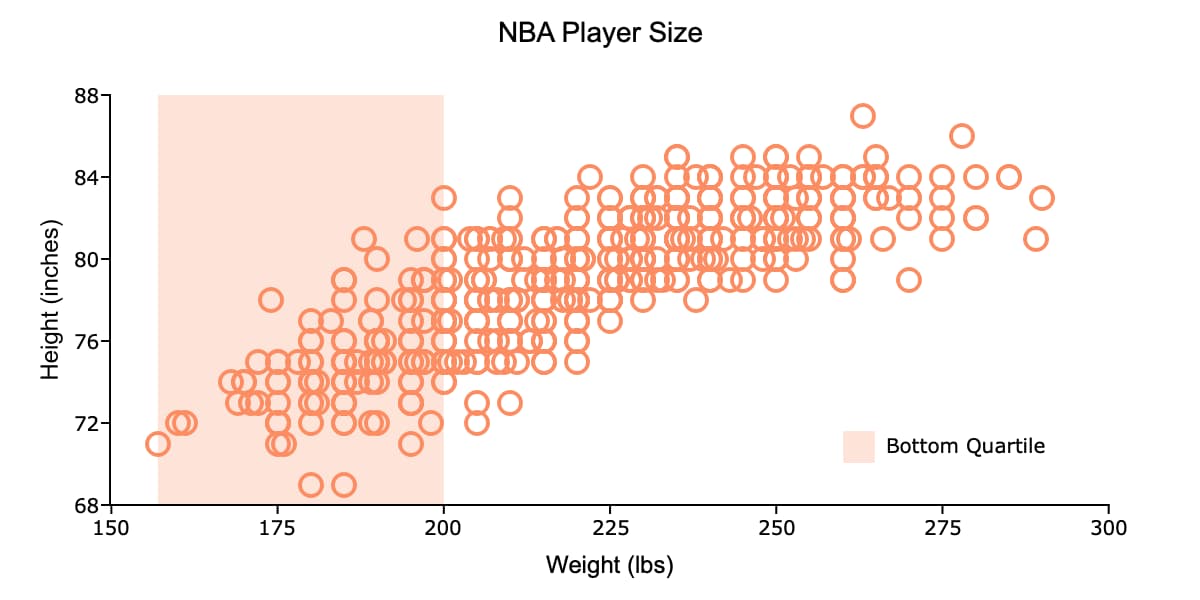
Add Bar Spanning the Bottom Quartile of X Variable#
// Create file name with full path
dataset = getGAUSSHome("examples/nba_ht_wt.xls");

// Load variables from the Excel file
nba = loadd(dataset, "Height + Weight");

// Declare plotControl structure and
// fill with default settings
struct plotControl plt;
plt = plotGetDefaults("scatter");

plotSetTitle(&plt, "NBA Player Size", "Arial", 14);

plotSetXLabel(&plt, "Weight (lbs)", "Arial", 12);
plotSetYLabel(&plt, "Height (inches)");


// Draw scatter plot
plotScatter(plt, nba, "height ~ weight");

/*
** Add vertical spanning bar to indicate
** bottom quartile
*/

// Compute bottom quartile
qtls = quantile(nba[.,"Weight"], 0|0.25);

// Overwrite plotControl structure with bar settings
plt = plotGetDefaults("bar");

// Solid fill that is 25% opaque (or 75% transparent)
plotSetFill(&plt, 1, 0.25);
plotSetLegend(&plt, "Bottom Quartile", "bottom right inside");

// Add a vertical bar from x=qtls[1] to x=qtls[2]
plotAddVBar(plt, qtls[1], qtls[2]);
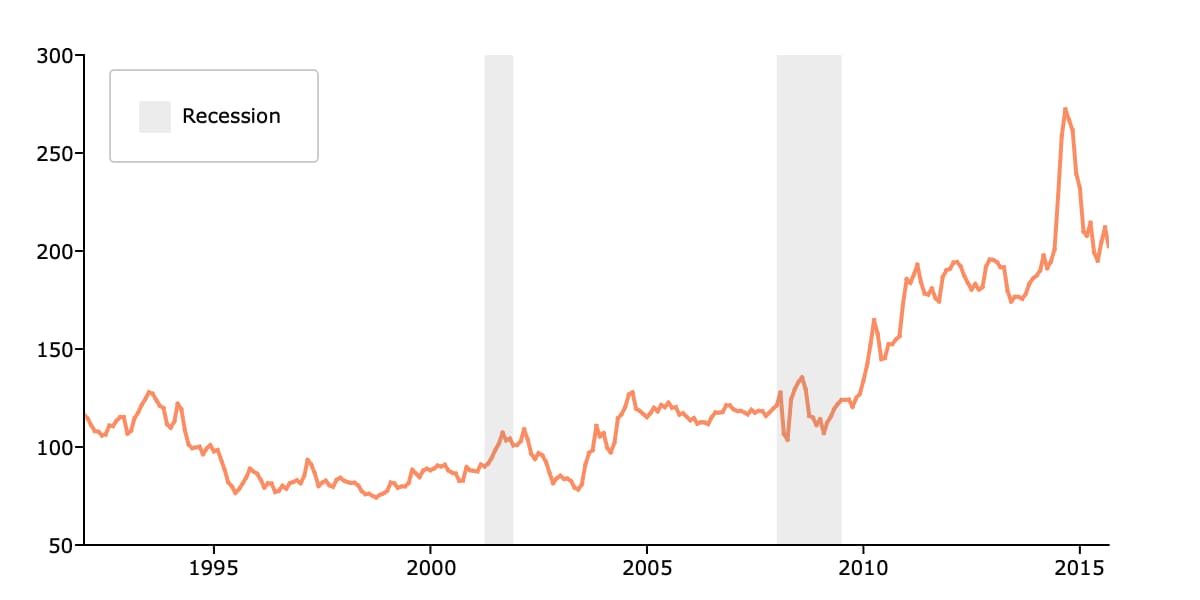
Add Recession Bars to a Time Series Plot#
This example draws recession bars based on a matrix where the first column is a date and the second column is a binary indicator vector. Where the binary indicator vector is 1, a bar is drawn. The data comes from the FRED USREC dataset.
/*
** Draw time series plot
*/

// Create string with path to examples folder
path = getGAUSSHome("examples/");

// Load variables from the CSV file
beef = loadd(path $+ "beef_prices.csv", "date(date) + beef_price");

// Declare plotControl structure
// and fill with default values
struct plotControl plt;
plt = plotGetDefaults("xy");

// Draw x-tick labels every 5 years, starting at 1995
plotSetXTicInterval(&plt, 5, asdate("1995"));

// Draw time series plot
plotTSHF(plt, beef[.,"date"], "years", beef[.,"beef_price"]);

/*
** Add recession bars
*/

// Load US recession data
usrec = loadd(path $+ "USREC.csv", "date(date) + USREC");

// Reset plotControl to default bar settings
plt = plotGetDefaults("bar");

// Bar fill: solid, 15% opaque and gray
plotSetFill(&plt, 1, 0.15, "gray");

// Add legend item
plotSetLegend(&plt, "Recession", "top left inside");

// Add vertical bars to any location where
// the second column of 'usrec' contains a 1
plotAddVBar(plt, usrec);
Remarks#
plotAddVBar() will add vertical spanning bars to existing graphs. It will not create a
new graph, however, if one does not already exist.
plotAddVBar() is not yet supported for surface plots.
See also
Functions plotAddHBar(), plotAddVLine()