plotSetOutlineEnabled#
Purpose#
Turns on an outline around the plot.
Format#
- plotSetOutlineEnabled(&myPlot, enabled)#
- Parameters:
&myPlot (struct pointer) – A
plotControlstructure pointer.enabled (scalar) – A 0 to hide the outline, or a 1 to show it.
Examples#
// Declare plotControl structure
struct plotControl myPlot;
// Initialize plotControl structure
myPlot = plotGetDefaults("scatter");
// Turn on plot outline
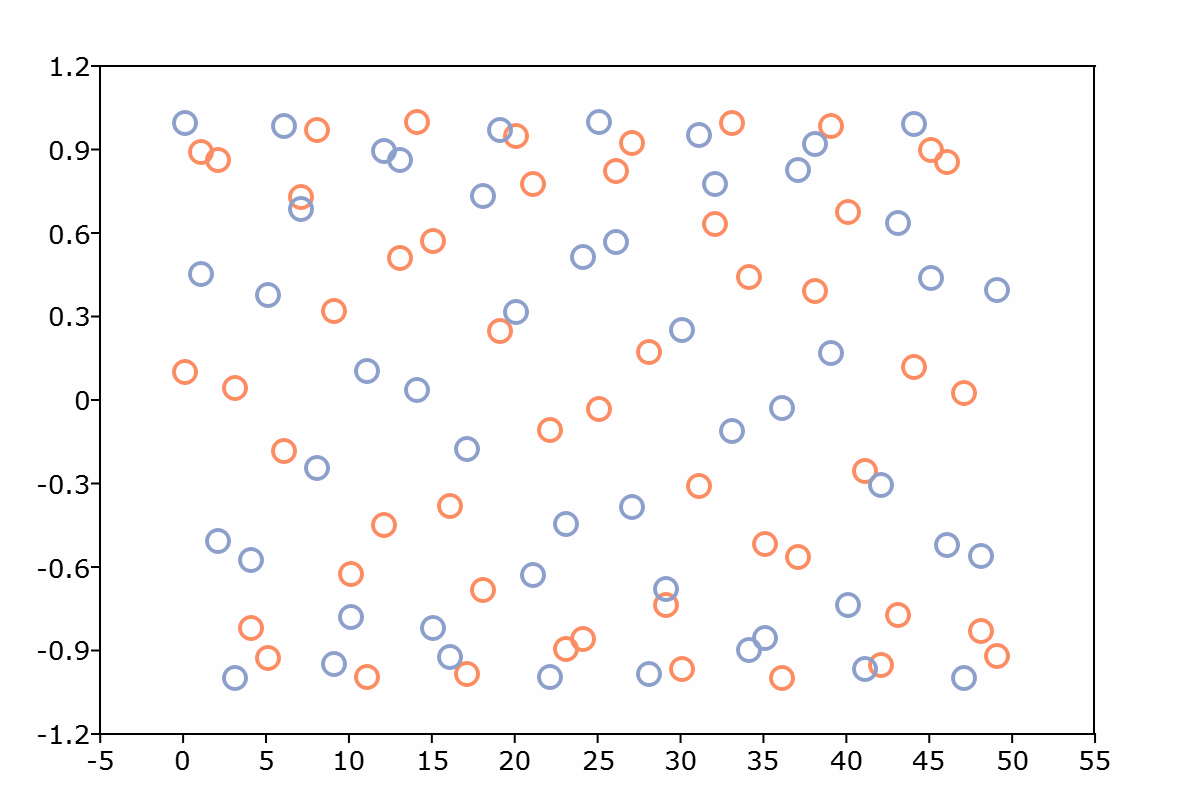
plotSetOutlineEnabled(&myPlot, 1);
// Create data
x = seqa(0.1, 1, 50);
y = sin(x)~cos(x);
// Plot the data with outline enabled.
plotScatter(myPlot, x, y);
Remarks#
Note
This function sets an attribute in a plotControl structure. It does not
affect an existing graph, or a new graph drawn using the default
settings that are accessible from the
menu.
See also
Functions plotGetDefaults(), plotSetXPen(), plotSetYPen(), plotSetAxesPen()