plotAddErrorBar#
Purpose#
Adds an error bar or a set of bars to an existing 2-D graph.
Format#
- plotAddErrorBar([myPlot, ]x, y, err)#
- plotAddErrorBar([myPlot, ]x, y, lwr, uppr)
- Parameters:
myPlot (struct) – Optional argument. A
plotControlstructure.x (scalar or Nx1 or NxM matrix) – Each column contains the X values for a particular line.
y (scalar or Nx1 or NxM matrix) – Each column contains the Y values for a particular line.
err (scalar or Nx1 or NxM matrix) – Each column contains the error values for each Y column.
lwr (Nx1 or NxM matrix) – Each column contains the lower bar heights for asymmetrical error bars.
uppr (Nx1 or NxM matrix) – Each column contains the upper bar heights for asymmetrical error bars.
Examples#
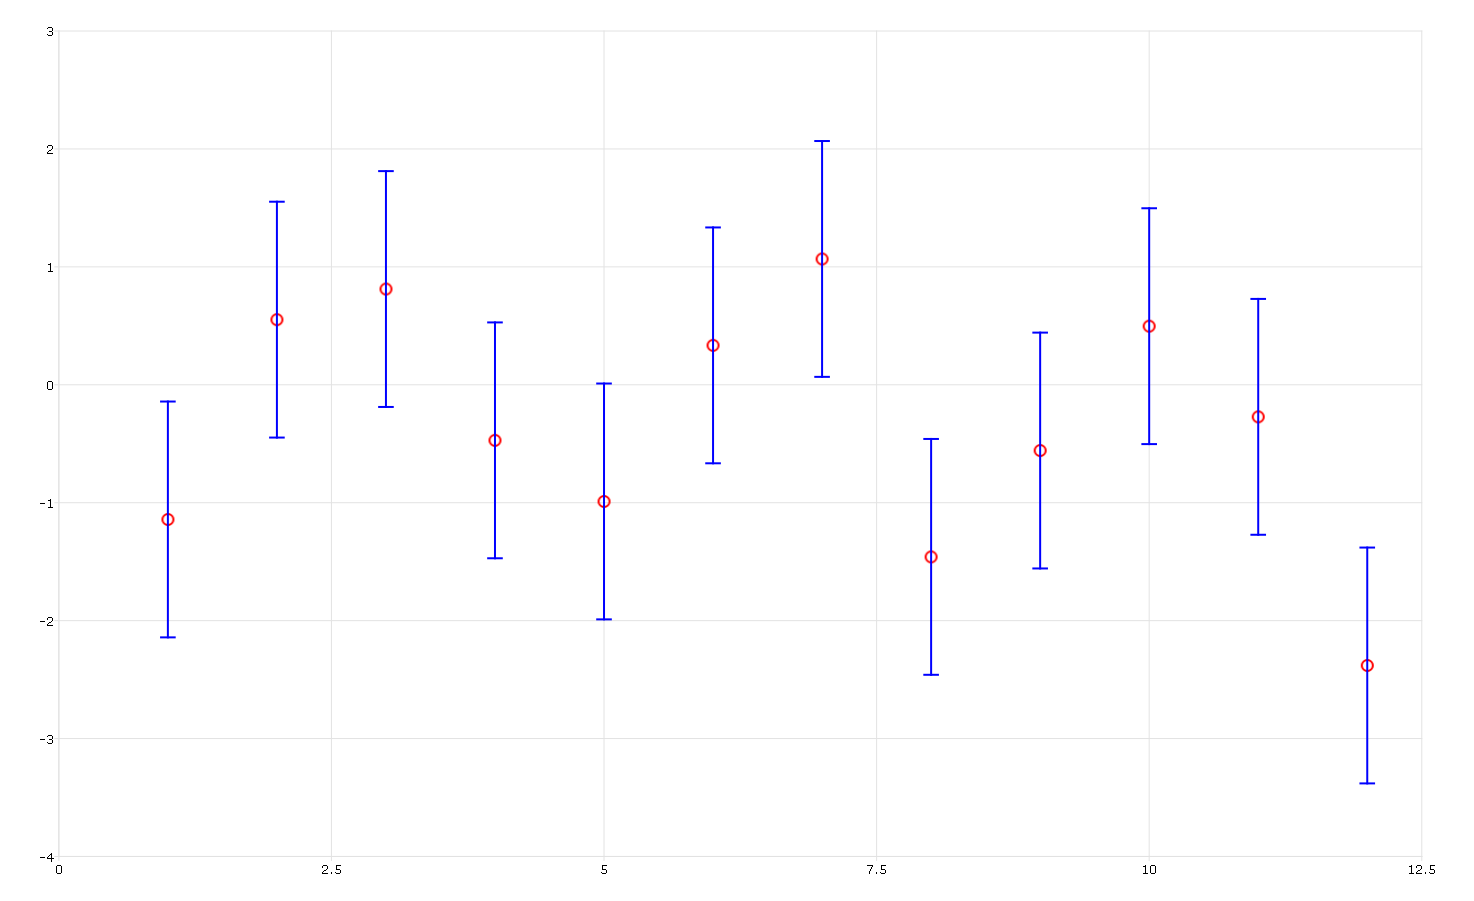
Basic addition of error bars to scatter plot#
new;

// Sequence 1, 2, 3...12
x = seqa(1, 1, 12);

// Create some random normal data, y ~ N(0, 1)
y = rndn(12, 1);

// 12x1 vector of all 1's
sd = ones(12, 1);

// Draw basic scatter plot, using default settings
plotScatter(x, y);

// Add error bars with height of 1
plotAddErrorBar(x, y, sd);
The plot is
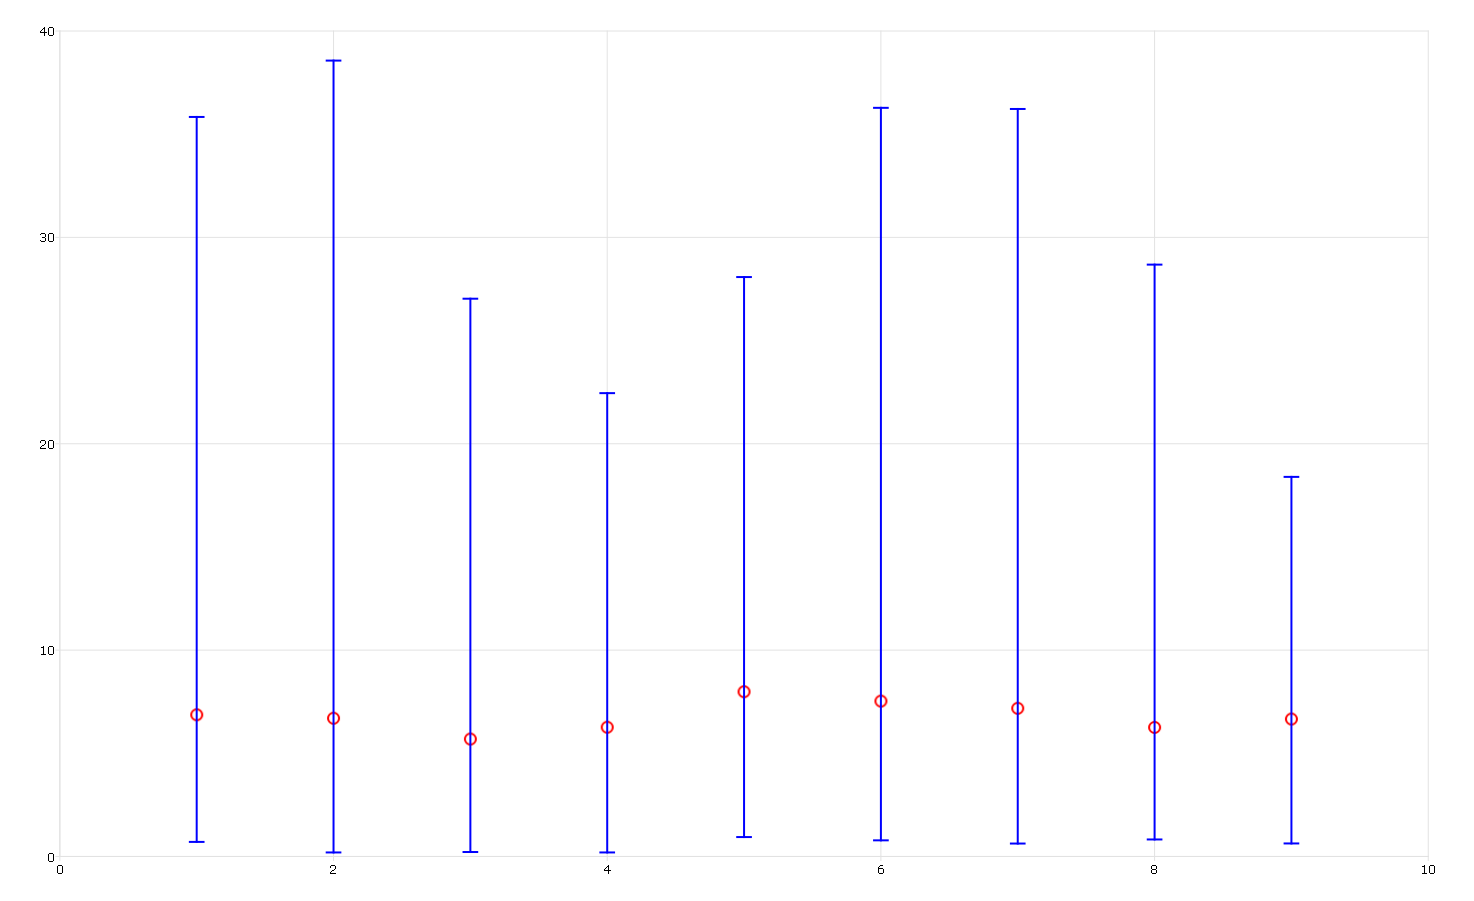
Assymetrical error bars to plot median and range#
new;

// Create the sequence 1, 2, 3...9
x = seqa(1, 1, 9);

// Create 9 gamma distributed column vectors
y = rndGamma(100, 9, 2, 4);

// Calculate medians of each column
med = median(y);

// Draw scatter plot of each median
plotScatter(x, med);

// Calculate the distance between the median
// and the min and max for each column
err_high = maxc(y) - med;
err_low = (med - minc(y));

// Add asymmetrical error bars to span
// the range of each column
plotAddErrorBar(x, med, err_low, err_high);
The plot is
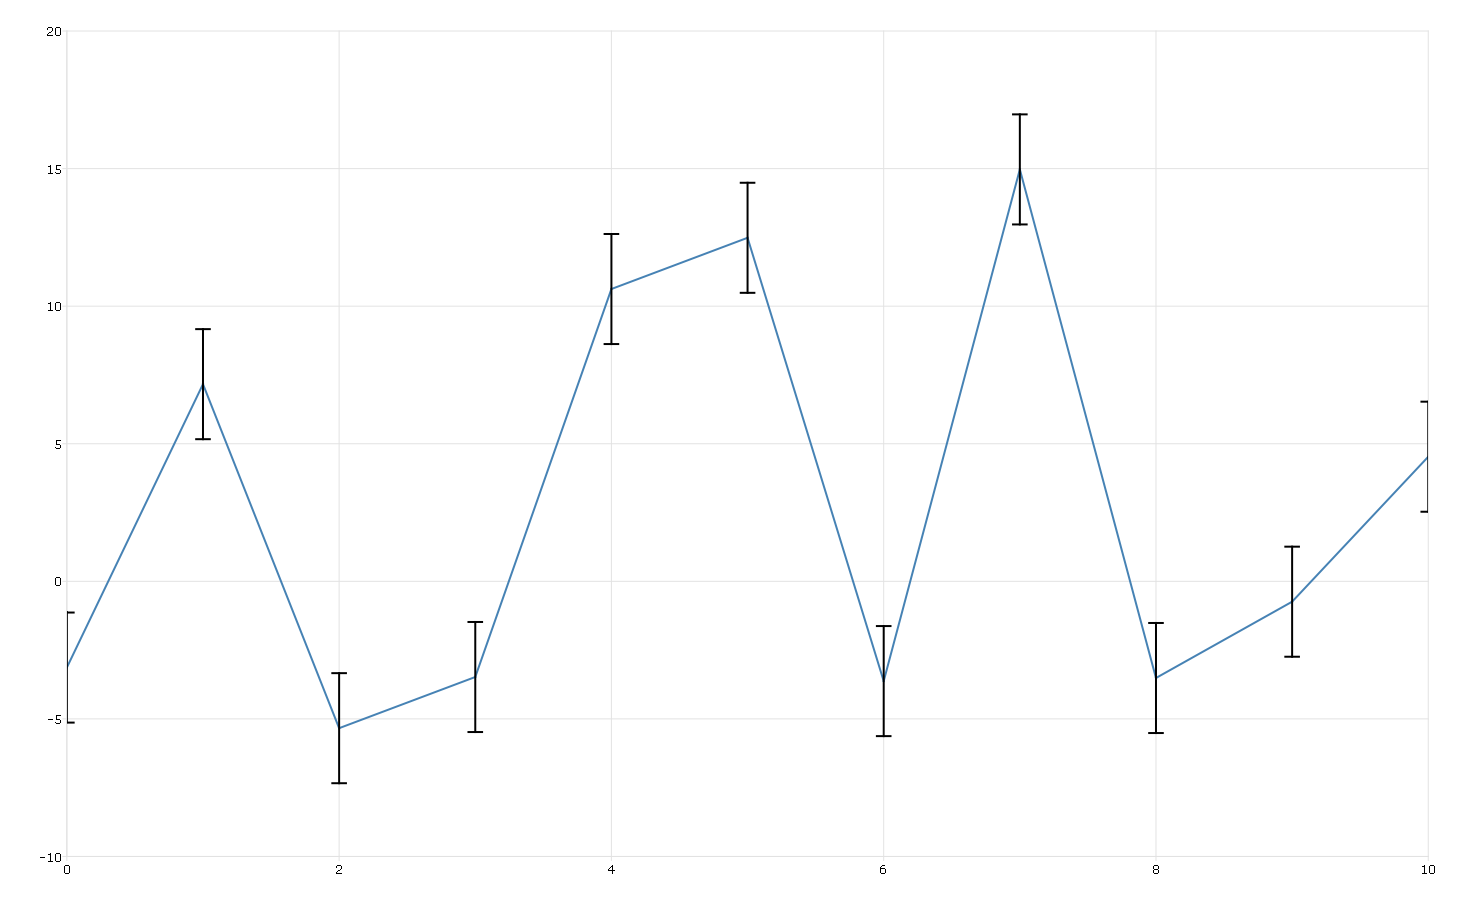
Add error bars to XY plot, using plotControl structure#
new;

// Create x values
x = seqa(0, 1, 11);

// Create y values
y = 10*rndn(11, 1);

// Define plotControl Structure
struct plotControl myPlot;
myPlot = plotGetDefaults("xy");

// Set color for main line
plotSetLineColor(&myPlot, "steel blue");

// Plot line
plotXY(myPlot, x, y);

// Set error bar values
err = ones(11, 1)*2;

// Set error bar color to be different than XY line
plotSetLineColor(&myPlot, "black");

// Add error bars
plotAddErrorBar(myPlot, x, y, err);
The plot is
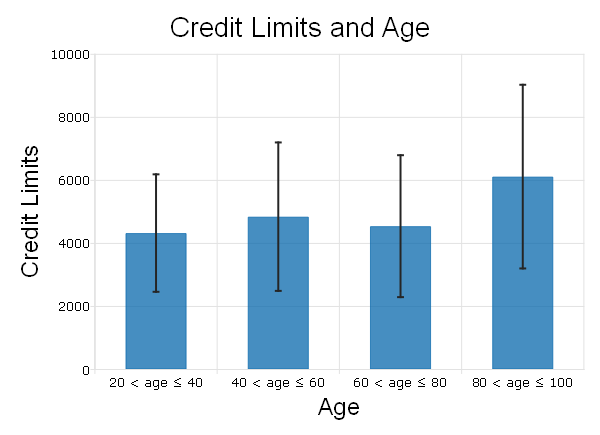
Add error bars to bar plot#
new;

// Load 'Age' and 'Limit' variables
// into a 2 column matrix
file = getGAUSSHome("/examples/credit.dat");
data = loadd(file, "Age + Limit");

age = data[., 1];
limit = data[., 2];

num_ranges = 4;
age_ranges = {  20 40,
                40 60,
                60 80,
               80 100 };

// Pre-allocate vector to hold means
// and standard deviation of the samples
mu = zeros(num_ranges, 1);
s = zeros(num_ranges, 1);

for i(1, num_ranges, 1);
    // Get the index for different age level
    level_idx = indexcat(age, age_ranges[i, .]');

    // mean of limit for different age level
    mu[i] = meanc(limit[level_idx]);

    // Calculate the standard deviation of the sample
    s[i] = stdc(limit[level_idx]);
endfor;

// Note: < is '<' in html
// '$|' is string concatenation
labels = "20 < age  ≤ 40" $|
         "40 < age  ≤ 60" $|
         "60 < age  ≤ 80" $|
         "80 < age  ≤ 100";

// Declare 'myPlot' to be a plotControl structure
// and fill with default settings for bar plots
struct plotControl myPlot;
myPlot = plotGetDefaults("bar");

// Set bar fill to be: solid, 100% opaque and steel blue
plotSetFill(&myPlot, 1, 1, "steel blue");

// Set title and axes labels
plotSetTitle(&myPlot, "Credit Limits and Age", "arial", 20);
plotSetYLabel(&myPlot, "Credit Limits", "arial", 18);
plotSetXLabel(&myPlot, "Age", "arial", 18);

// Draw bar plot
plotBar(myPlot, labels, mu);

// File 'myPlot' plotControl structure with
// default settings for 'xy' plots
myPlot = plotGetDefaults("xy");

plotSetLineColor(&myPlot, "black");

//'x' location of error bars
// 1 is first bar, 2 is second bar, etc
x = seqa(1, 1, num_ranges);

// Draw error bars on bar plot
plotAddErrorBar(myPlot, x, mu, s);
The plot is
See also
Functions plotBar()