myPlot (struct) – Optional argument, a plotControl structure.
x (Nx1 or NxM matrix) – Each column contains the X values for a particular line.
y (Nx1 or NxM matrix) – Each column contains the Y values for a particular line.
df (dataframe) – name of the dataframe in memory.
formula (string) –
formula string of the model to be plotted.
E.g "y~X1", y is the name of dependent variable to be plotted on the y-axis X1 is the names of the variable to be plotted on the x-axis;
E.g "y~X1+by(X2)", by(X2) specifies that the data should be separated into different lines based on the groups defined by X2.
// Create string with full path to file namefname=getGAUSSHome("examples/clotting_time.dat");// Load all variables from the datasetclotting_time=loadd(fname);// Draw plot using formula string to specify variablesplotXY(clotting_time,"lot1 ~ plasma");
Create previous plot with indexing and plot customization#
You can create the same plot from the example above without using a formula string as shown below.
// Create string with full path to file namefname=getGAUSSHome("examples/clotting_time.dat");// Load all variables from the datasetclotting_time=loadd(fname);structplotControlplt;plt=plotGetDefaults("xy");// Set x and y label textplotSetXLabel(&plt,"plasma","arial",12);plotSetYLabel(&plt,"lot1");// Draw plot using indexing to specify x and y variablesplotXY(plt,clotting_time[.,"plasma"],clotting_time[.,"lot1"]);
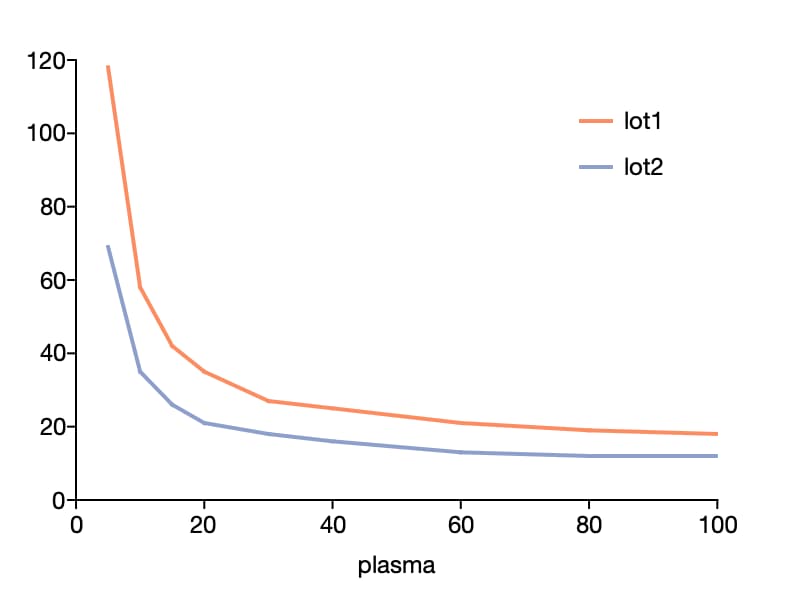
// Create string with full path to file namefname=getGAUSSHome("examples/clotting_time.dat");// Load all variables from the datasetclotting_time=loadd(fname);// Draw plot using formula string to specify variablesplotXY(clotting_time,"lot1 + lot2 ~ plasma");
Create previous plot with indexing and plot customization#
You can create the same plot from the example above without using a formula string as shown below.
// Create string with full path to file namefname=getGAUSSHome("examples/clotting_time.dat");// Load all variables from the datasetclotting_time=loadd(fname);structplotControlplt;plt=plotGetDefaults("xy");// Set x label text and fontplotSetXLabel(&plt,"plasma","arial",12);plotSetLegend(&plt,"lot1"$|"lot2");// Draw plot using indexing to specify x and y variablesplotXY(plt,clotting_time[.,"plasma"],clotting_time[.,"lot1""lot2"]);

 // Create string with full path to file name fname = getGAUSSHome("examples/clotting_time.dat"); // Load all variables from the dataset clotting_time = loadd(fname); // Draw plot using formula string to specify variables plotXY(clotting_time, "lot1 + lot2 ~ plasma");