plotXYFill#
Purpose#
Creates an area plot between sets of 2-D vectors.
Format#
- plotXYFill([myPlot, ]x, y_bottom, y_top)#
- Parameters:
myPlot (struct) – Optional argument, a
plotControlstructurex (Nx1 matrix) – The X values for a particular line.
y_bottom (Nx1 or NxM matrix) – Each column contains the Y values for the bottom of a filled area. If y_bottom contains more than one column, each column will be the bottom for a different area.
y_top (Nx1 or NxM matrix) – Each column contains the Y values for the top of a filled area. If y_top contains more than one column, each column will be the top for a different area.
Examples#
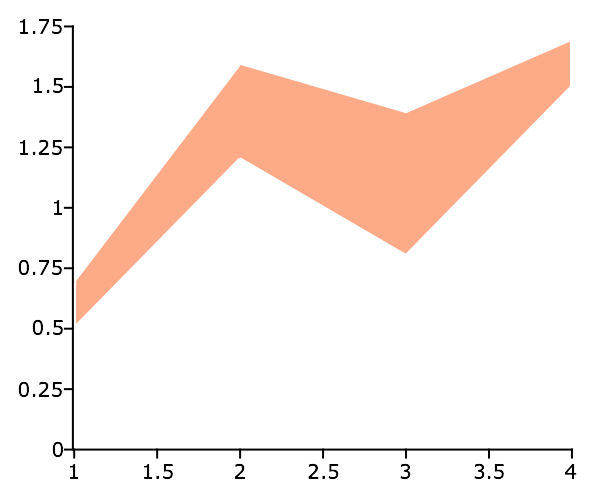
One set of vectors#
x = { 1, 2, 3, 4 };
y_bottom = { 0.5,
             1.2,
             0.8,
             1.5 };
y_top    = { 0.7,
             1.6,
             1.4,
             1.7 };

// Draw an area plot between the vectors
plotXYFill(x, y_bottom, y_top);
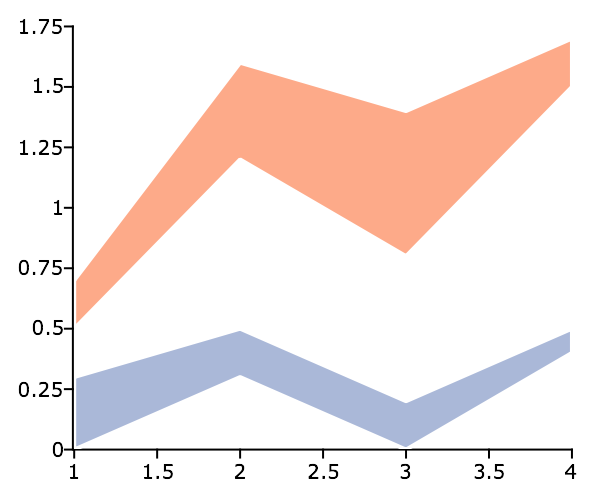
Two sets of vectors#
x = { 1, 2, 3, 4 };
y_bottom = { 0.5   0,
             1.2 0.3,
             0.8 0.0,
             1.5 0.4 };
y_top    = { 0.7 0.3,
             1.6 0.5,
             1.4 0.2,
             1.7 0.5 };


// Draw an area plot between the pairs of vectors
plotXYFill(x, y_bottom, y_top);
See also
Functions plotArea(), plotSetFill(), plotXY()