plotSetZLevels#
Purpose#
Controls the heights at which lines are drawn on a contour plot.
Format#
- plotSetZLevels(&myPlot, zlevels)#
- Parameters:
&myPlot (struct pointer) – A
plotControlstructure pointer.zlevels (scalar or Nx1 vector) – If zlevels is a scalar, zlevels represents the number of different heights at which to draw contour lines (from
min(Z)tomax(Z)). If zlevels is an Nx1 vector, zlevels indicates the heights at which to draw the contour lines.
Examples#
Basic example setting number of lines#
// Linear sequence from -3 to +3
y = seqa(-3, 0.1, 61);
x = y';

// Joint probability of 'x' and 'y'
z = pdfn(x) .* pdfn(y);

// Declare plotControl structure
// and fill in with defaults for surface/contour
struct plotControl myPlot;
myPlot = plotGetDefaults("surface");

// Set number of lines to be drawn
// MIN(Z) < Line 1 < Line 2 < Line 3 < Line 4 < MAX(Z)
plotSetZLevels(&myPlot, 4);

// Draw contour plot with 4 lines
plotContour(myPlot, x, y, z);
Basic example setting heights of lines#
Continuing with the data and plotControl structure created in the example above:
// Draw lines at z == 0.05 and when z == 0.1
plotSetZLevels(&myPlot, 0.05 | 0.1);

// Draw contour plot with lines at 0.05 and 0.1
plotContour(myPlot, x, y, z);
Example 3#
// Clear out variables in GAUSS workspace
new;
// Create data
x = seqa(-4, .125, 161)';
y = seqa(-8, .125, 161);
z = sin(x) .* cos(y) * .5;
z = z .* sin(x/3) .* cos(y/3);
z = z .* sin(x/5) + sin(y/2.5)/3 + sin(x/2.5)/3;
// Set up control structure with defaults
// for surface plots
struct plotControl myPlot;
myPlot = plotGetDefaults("surface");
// Set title and Z axis label
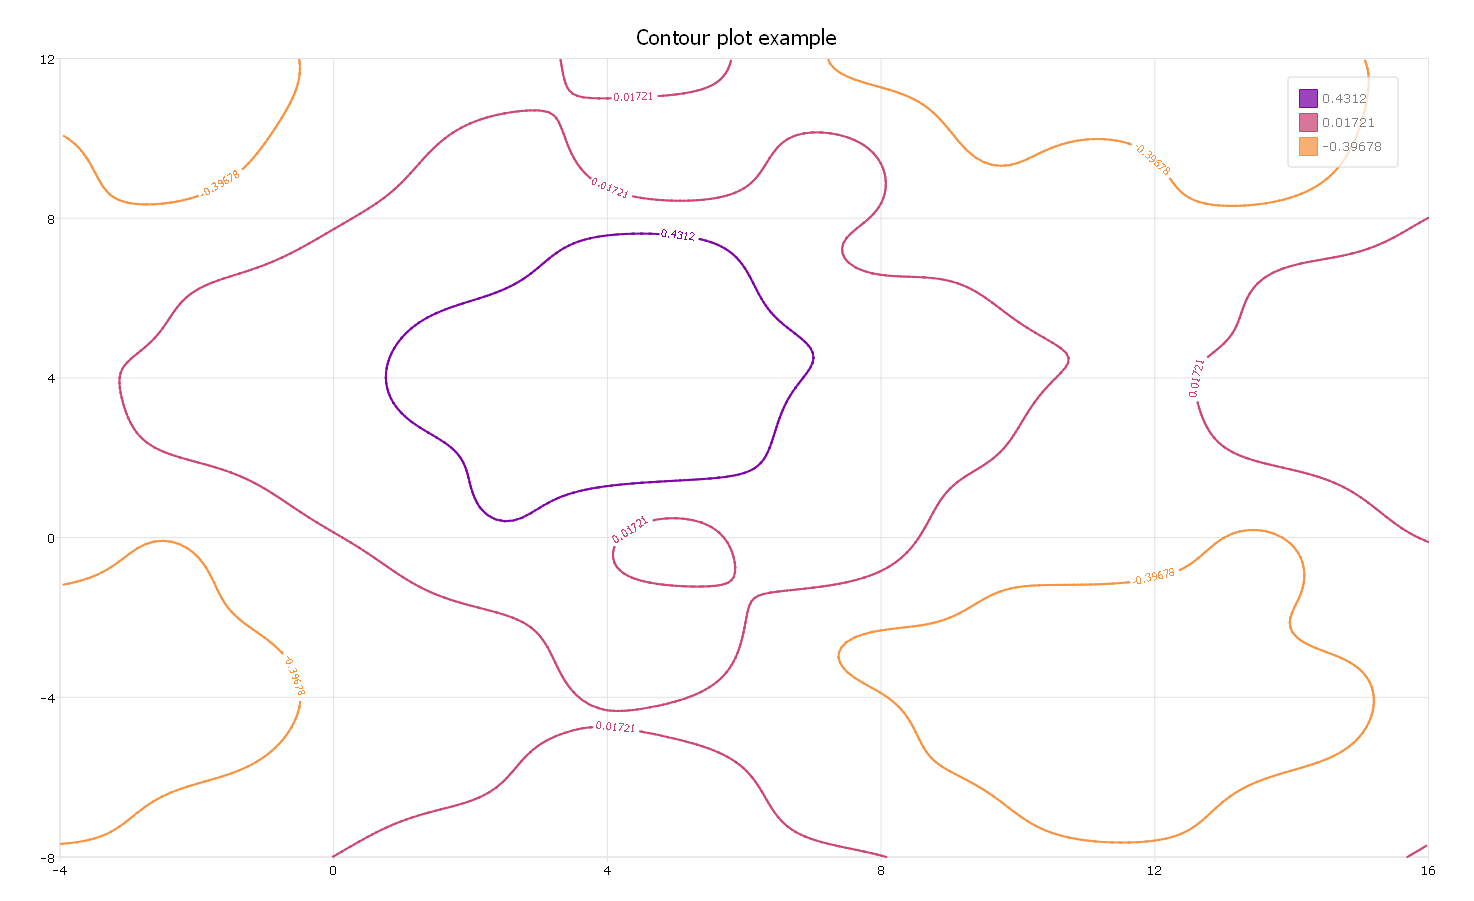
plotSetTitle(&myPlot, "Contour plot example");
// Set color map for contour
plotSetColorMap(&myplot, "plasma");
// Set up flag of show label for contour
showLabels = 1;
// Set up format for contour label
labelFormat = "g";
// Set up precision for contour label
labelPrecision = 5;
// Use function to set up contour labels
plotSetContourLabels(&myplot, showlabels, labelFormat, labelPrecision);
// Use function to set up contour z levels = 3
plotSetZLevels(&myplot, 3);
// Draw graph using plotcontrol structure
plotContour(myPlot, x, y, z);
The plot is
Remarks#
To indicate a single Z-level, pass in a 2x1 vector with the same value for both elements:
single_level = { 1.5, 1.5 };
plotSetLevels(&myPlot, single_level);
Note
This function sets an attribute in a plotControl structure. It does not
affect an existing graph, or a new graph drawn using the default
settings that are accessible from the
menu.
See also
Functions plotGetDefaults(), plotSetColorMap(), plotSetContourLabels()