plotPACF#
Purpose#
Plot the partial autocorrelations function (PACF).
Format#
- plotPACF([myPlot, ]x, k, d)#
- Parameters:
myPlot (struct) – Optional argument, a
plotControlstructurex (Nx1 vector) – data.
k (scalar) – maximum number of autocorrelations to compute.
d (scalar) – order of differencing.
Examples#
// Clear out variables in GAUSS workspace
new;
// Create file name with full path
file = getGAUSSHome("examples/beef_prices.csv");
// Import dataset starting with row 2 and column 2
x = csvReadM(file, 2, 2);
// Max lags
k = 20;
// Order of differencing
d = 1;
// PACF plot
struct plotControl mp;
mp = plotGetDefaults("bar");
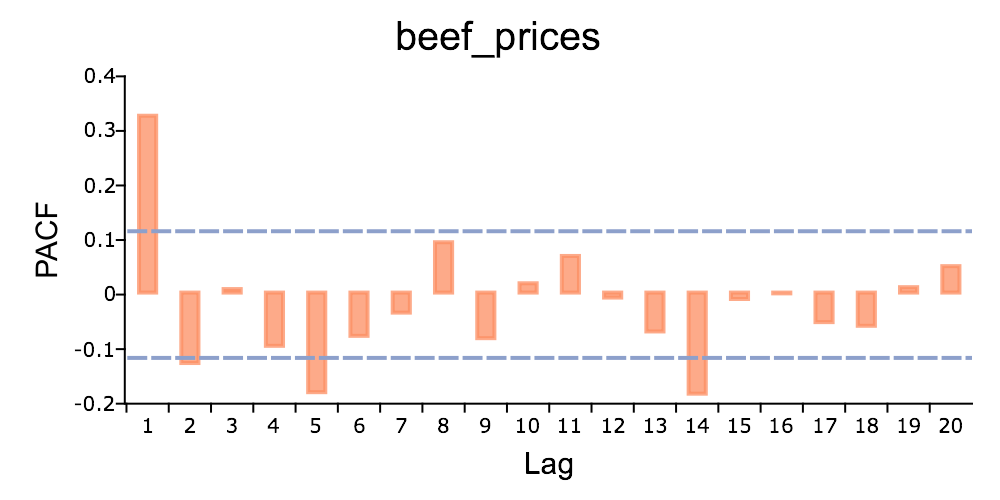
plotSetTitle(&mp, "beef_prices", "Arial", 20);
plotPACF(mp, x, k, d);
The plot is
Remarks#
To control the color and texture of the bars:
If you are passing a
plotControlstructure toplotPACF(), you may use the functionplotGetDefaults()andplotSetBar().If you are not passing a
plotControlstructure, these properties are set in the Preferences. To access the Graphics Preferences, select from the GAUSS main menu. Select ‘’Graphics’’ on the left side of the preferences and then select ‘’Bar’’ from the list of graph types.