plotTSHF#
Purpose#
Plots high-frequency and irregularly spaced time series data.
Format#
- plotTSHF([myPlot, ]date_vec, label_unit, y)#
- Parameters:
myPlot (struct) – Optional argument, a
plotControlstructure.date_vec (Nx1 vector) –
containing the dates for each observation in the y . The dates in date_vec are required to be:
In POSIX time/date format i.e. seconds since Jan 1, 1970.
Sorted, increasing.
However, the dates in date_vec may be:
Irregularly spaced
Any frequency which can be represented by DT Scalar format, such as by year, quarter, month, week, day, hour, minute, second or millisecond.
label_unit (string) –
containing the frequency with which to display the x-axis tick labels. Valid options include:
”milliseconds”
”seconds”
”minutes”
”hours”
”days”
”months”
”quarters”
”years”
y (Nx1 or NxM matrix) – Each column contains the Y values for a particular line.
Examples#
Basic TS plot with tick labels in terms of minutes#
// Dates in DT Scalar format for readability
// October 09, 2008 6:30:00 - 6:32:30
dt = { 20081009063000,
       20081009063030,
       20081009063100,
       20081009063130,
       20081009063200,
       20081009063230 };

// Convert dates to seconds since epoch for plotTSHF
dt = dttoutc(dt);

// Some random data to plot
y = rndu(rows(dt), 1);

// Plot the data, with tick labels
// in terms of seconds
plotTSHF(dt, "minutes", y);
Plot Forex tick data with custom X-tick labels#
// Create file name with full path
file = getGAUSSHome("examples/eurusd_tick.csv");

// Load dates into df from file
// Dates format looks like: "20081031 125145000"
dt_forex = loadd(file, "date");

// Shorten span
dt_gr = dt_forex[1:20];

// Load bid and ask quotes
y = loadd(file, "bid + ask");
y = y[1:rows(dt_gr), .];

// Declare plotControl structure
// and fill with default settings
struct plotControl myPlot;
myPlot = plotGetDefaults("xy");

// Create an X-tick label every 15 seconds
// Set the first tick label at:
// October 31st, 2008 at 45 seconds after midnight
first_label = asDate("2008 10 31 12:52", "%Y %m %d %H:%M");
plotSetXTicInterval(&myPlot, 15, first_label);

// Draw the time series plot
plotTSHF(myPlot, dt_gr, "seconds", y);
T-bill plot with full date vector#
// Create file name with full path
file = getGAUSSHome("examples/tbill_3mo.xlsx");

// Load date vector and tbill data
x = loadd(file, "obs_date + tbill_3m");

// Separate date vector and tbill data
date_vec = x[., "obs_date"];
y = x[ ., "tbill_3m"];

// Specify that tick labels should be
// on years, even though the data is monthly
label_unit = "years";

// Draw the time series plot
plotTSHF(date_vec, label_unit, y);
Daily data with full date vector#
// Fully pathed file name
fname = getGAUSSHome("examples/xle_daily.xlsx");

// Load all observations from variables,
// 'Date' and 'Adj Close'
data = loadd(fname, "Date + Adj Close");

// Filter to include observations before 2018
data = selif(data, data[., "Date"] .< "2018");

// Draw plot of this daily data, specifying
// that the X-tick labels should be set in
// terms of months
plotTSHF(data[., "Date"], "months", data[., "Adj Close"]);
Time Series Plot With Custom X-ticks#
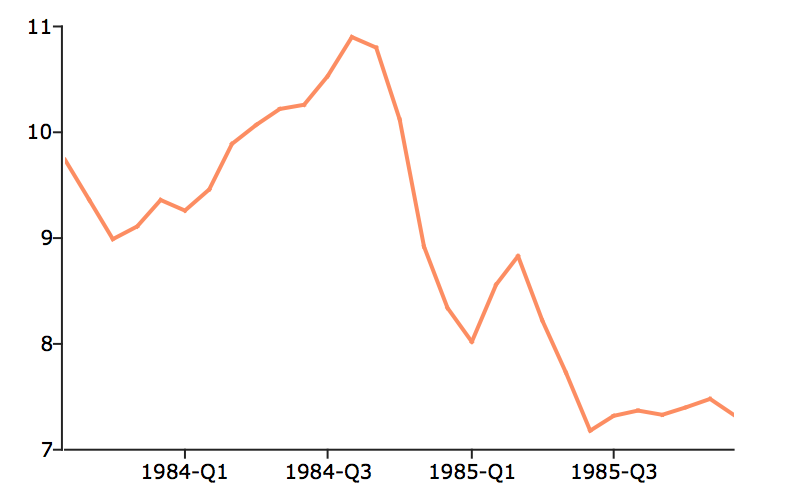
// Create file name with full path
file = getGAUSSHome("examples/tbill_3mo.xlsx");

// Load data
data = loadd(file);

// Filter to include data prior to 1986
// and after 1983 Q4
data = selif(data, data[., "obs_date"] .< "1986" .and data[., "obs_date"] .> "1983-07");

// Declare 'myPlot' to be a plotControl structure
// and fill it with 'xy' default settings
struct plotControl myPlot;
myPlot = plotGetDefaults("xy");

// Place first x-tick mark at 1984 month 1 and draw one every 2 quarters
// Note that we pass in the first_labeled date in posix format
plotSetXTicInterval(&myPlot, 2, asDate("1984"));

// Display only 4 digit year on x-tick labels
plotSetXTicLabel(&myPlot, "YYYY-QQ");

// Draw time series plot, using settings in 'myPlot'
plotTSHF(myPlot, data[., "obs_date"], "quarters", data[., "tbill_3m"]);
Remarks#
Formatting for the x-tick labels can be set with the function
plotSetXTicLabel(). If a plotControl structure is not passed in to
plotTSHF(), or the format specifier is not set with plotSetXTicLabel() the
default formatting based on the time label unit and is as follows:
“years” |
“YYYY” |
“quarters” |
“YYYY-QQ” |
“months” |
“YYYY-MO” |
“days” |
“MO-DD” |
“hours” |
“HH:MI” |
“minutes” |
“HH:MI” |
“seconds” |
“HH:MI:SS” |
“milliseconds” |
“HH:MI:SS.zzz” |
By default missing values in the y variable will be represented as gaps in the line.
See also
Functions plotSetXTicLabel(), plotSetXTicInterval(), plotScatter(), plotTS(), plotTSLog()