plotSetXTicCount#
Purpose#
Controls the number of major ticks on the x-axis of a 2-D plot.
Format#
- plotSetXTicCount(&myPlot, num_tics)#
- Parameters:
&myPlot (struct pointer) – A
plotControlstructure pointer.num_tics (Scalar) – the number of major ticks to place on the x-axis.
Examples#
// Create some data to plot
x = seqa(-3, 0.1, 61);
y = x.^3 + rndn(rows(x), 1);

// Plot the data
plotXY(x, y);
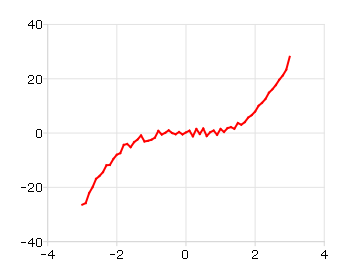
5 tick marks#
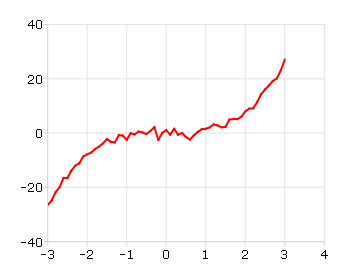
will produce a graph that looks similar to the one above, with 5 major tick marks on the x-axis. If we use 8 tick marks, there will be one major tick for every integer on the x-axis. We can make that change like this:
// Declare and initialize plotControl structure
struct plotControl myPlot;
myPlot = plotGetDefaults("xy");

// Set the x-axis to have 8 tick marks
plotSetXTicCount(&myPlot, 8);

// Plot the data, using the plotControl structure
plotXY(myPlot, x, y);
Remarks#
Note that plotSetXTicInterval() does not provide complete control over the
x-axis ticks. If the number of x-ticks requested would cause an odd x-tick
interval, GAUSS will create a number of ticks that will provide more even
spacing. For instance, in the example above, 8 ticks gave a space between
ticks of 1. If we chose 9 ticks, the spacing between ticks would be 0.889.
In that case, GAUSS would instead draw 8 ticks for a more even
appearance.
For more control over the x-axis of time series plots, use
plotSetXTicInterval() instead.
Note
This function sets an attribute in a plotControl structure. It does not
affect an existing graph, or a new graph drawn using the default
settings that are accessible from the
menu.
The axis updated by this function is determined by the value previously specified by plotSetActiveX(). The accepted values are "bottom" (default), "top", and "both".
Future calls to plotSetActiveX() will not retroactively change the values of a previously modified axis.
See also
Functions plotSetXTicInterval(), plotSetXLabel()