plotTS#
Purpose#
Creates a graph of time series data.
Format#
- plotTS([myPlot, ]dtstart, frequency, y)#
- plotTS([myPlot, ]date_vec, label_unit, y)
- Parameters:
myPlot (struct) – Optional argument, a
plotControlstructure.dtstart (scalar) – starting date in DT scalar format. This input is used when the data is evenly spaced and yearly, quarterly or monthly.
frequency (scalar) –
frequency of the data per year.
Note
This option is only used with the scalar dtstart input. Valid options include:
1
Yearly
4
Quarterly
12
Monthly
date_vec (Nx1 vector) –
containing the dates for each observation in the y. The dates in date_vec are required to be:
In DT Scalar format.
Sequential.
However, the dates in date_vec may be:
Irregularly spaced
Any freqency which can be represented by DT Scalar format, such as by year, quarter, month, week, day, hour, minute and second.
label_unit (string) –
containing the frequency with which to display the x-axis tick labels.
Note
This input is only used with a full length date_vec vector. Valid options include:
”seconds”
”minutes”
”hours”
”days”
”months”
”quarters”
”years”
y (Nx1 or NxM matrix) – Each column contains the Y values for a particular line.
Examples#
Basic time series plot with start date#
// Create some data to plot
y = rndn(100, 1);

// The first input starts the series in January of 1982
// The second input specifies the data to be monthly
plotTS(1982, 12, y);
T-bill plot with scalar start date#
// Create file name with full path
file = getGAUSSHome("examples/tbill_3mo.xlsx");

// Load scalar starting date
date_1 = xlsReadM(file, "A2:A2");

// Load the first 20 observations from the time series
y = xlsReadM(file, "B2:B20");

// Specify the data is monthly
freq = 12;

// Draw the time series plot
plotTS(date_1, freq, y);
T-bill plot with full date vector#
// Create file name with full path
file = getGAUSSHome("examples/tbill_3mo.xlsx");

// Load date vector and tbill data
x = loadd(file, "obs_date + tbill_3m");

// Separate date vector and tbill data
date_vec = x[., 1];
y = x[., 2];

// Specify that tick labels should be
// on years, even though the data is monthly
label_unit = "years";

// Draw the time series plot
plotTS(date_vec, label_unit, y);
Daily data with full date vector#
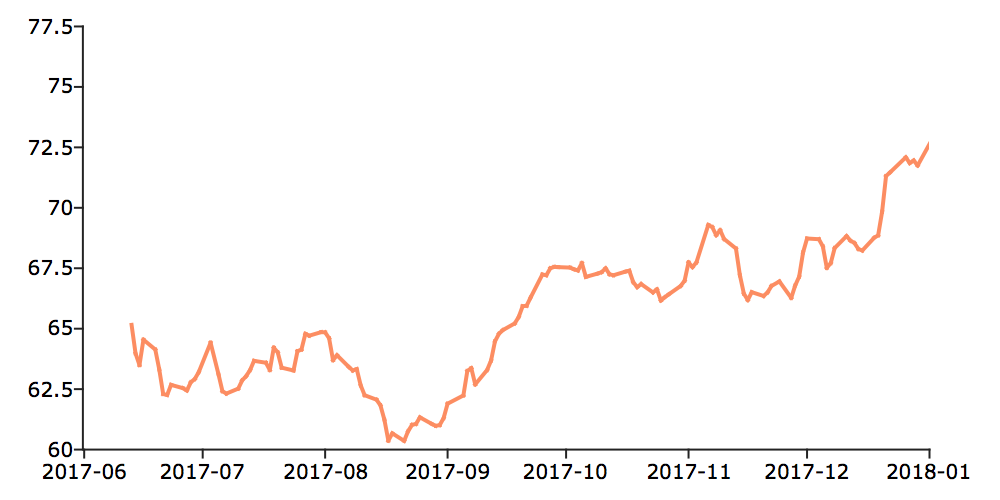
// Fully pathed file name
fname = getGAUSSHome("examples/xle_daily.xlsx");

// Load all observations from variables,
// 'Date' and 'Adj Close'
data = loadd(fname, "Date + Adj Close");

// Select the first 150 observations
// from the date vector and the adjusted close
nobs = 150;
date_vec = data[1:nobs, 1];
closing_price = data[1:nobs, 2];

// Draw plot of this daily data, specifying
// that the X-tick labels should be set in
// terms of months
plotTS(date_vec, "months", closing_price);
Time Series Plot With Custom X-ticks#
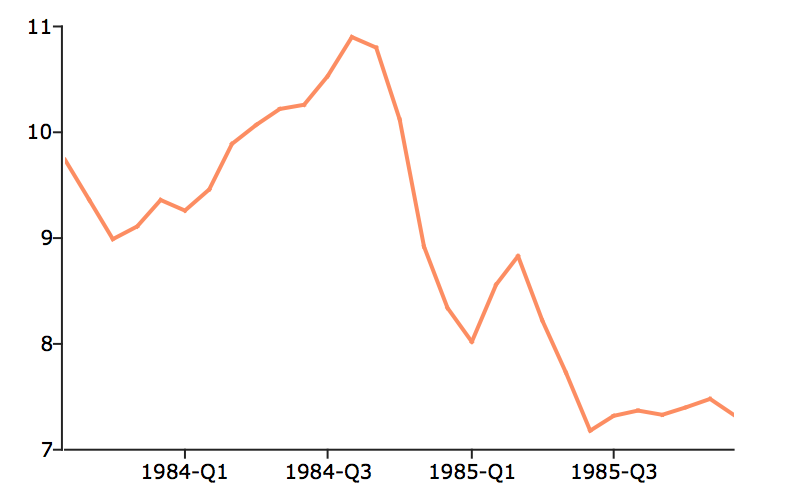
// Create file name with full path
file = getGAUSSHome("examples/tbill_3mo.xlsx");

// Load date of observation 20 (header is row 1)
date_1 = xlsReadM(file, "A21:A21");

// Load 28 observations
y = xlsReadM(file, "B21:B49");

// Declare 'myPlot' to be a plotControl structure
// and fill it with 'xy' default settings
struct plotControl myPlot;
myPlot = plotGetDefaults("xy");

// Place first 'X' tick mark at 1984 month 1 and draw one every 6 months
plotSetXTicInterval(&myPlot, 6, 1984);

// Display only 4 digit year on 'X' tick labels
plotSetXTicLabel(&myPlot, "YYYY-QQ");

// Draw time series plot, using settings in 'myPlot'
plotTS(myPlot, date_1, 12, y);
Example 6#
In DT Scalar format, quarters are represented by supplying the first month of the quarter for the sixth and seventh leading digits. As we see below, 200504 represents April of 2005, but it also represents the second quarter of April 2005.
// The first input starts the series in the second quarter of 2005
// The second input specifies the data to be quarterly
plotTS(200504, 4, y);
Remarks#
Formatting for the X-tick labels can be set with the function
plotSetXTicLabel(). If a plotControl structure is not passed in to plotTS(),
or the format specifier is not set with plotSetXTicLabel() the default
formatting: for annual data is "YYYY", for quarterly data "YYYY-QQ" and
for monthly data is "YYYY-MO".
Note
By default missing values in the y variable will be represented as gaps in the line.
See also
Functions plotSetXTicLabel(), plotSetXTicInterval(), plotScatter(), plotTSHF(), plotTSLog()