plotSetContourLabels#
Purpose#
Sets the contour label for a graph.
Format#
- plotSetContourLabels(&myPlot, show_labels[, label_format[, label_precision]])#
- Parameters:
&myPlot (struct pointer) – A
plotControlstructure pointer.show_labels (scalar) – 0 or 1. The flag of show labels on contours.
label_format (string) –
Optional argument. Format options:
”D”
e.g. 1.234567;
”E”
e.g.1.23E1;
”G”
”G” is either “D” or “E”, whichever is more compact
label_precision (scalar) – Optional argument, precision of contour label.
Examples#
// Clear out variables in GAUSS workspace
new;
// Create data
x = seqa(-4, .125, 161)';
y = seqa(-8, .125, 161);
z = sin(x) .* cos(y) * .5;
z = z .* sin(x/3) .* cos(y/3);
z = z .* sin(x/5) + sin(y/2.5)/3 + sin(x/2.5)/3;
// Set up control structure with defaults
// for surface plots
struct plotControl myPlot;
myPlot = plotGetDefaults("surface");
// Set title and Z axis label
plotSetTitle(&myPlot, "Contour plot example", "arial", 16, "black");
// Set color map for contour
plotSetColorMap(&myplot, "viridis");
// Set up flag of show label for contour
showLabels = 1;
// Set up format for contour label
label_format = "G";
// Set up precision for contour label
label_precision = 5;
// Use function to set up contour labels
plotSetContourLabels(&myplot, showlabels, label_format, label_precision);
// Draw graph using plotcontrol structure
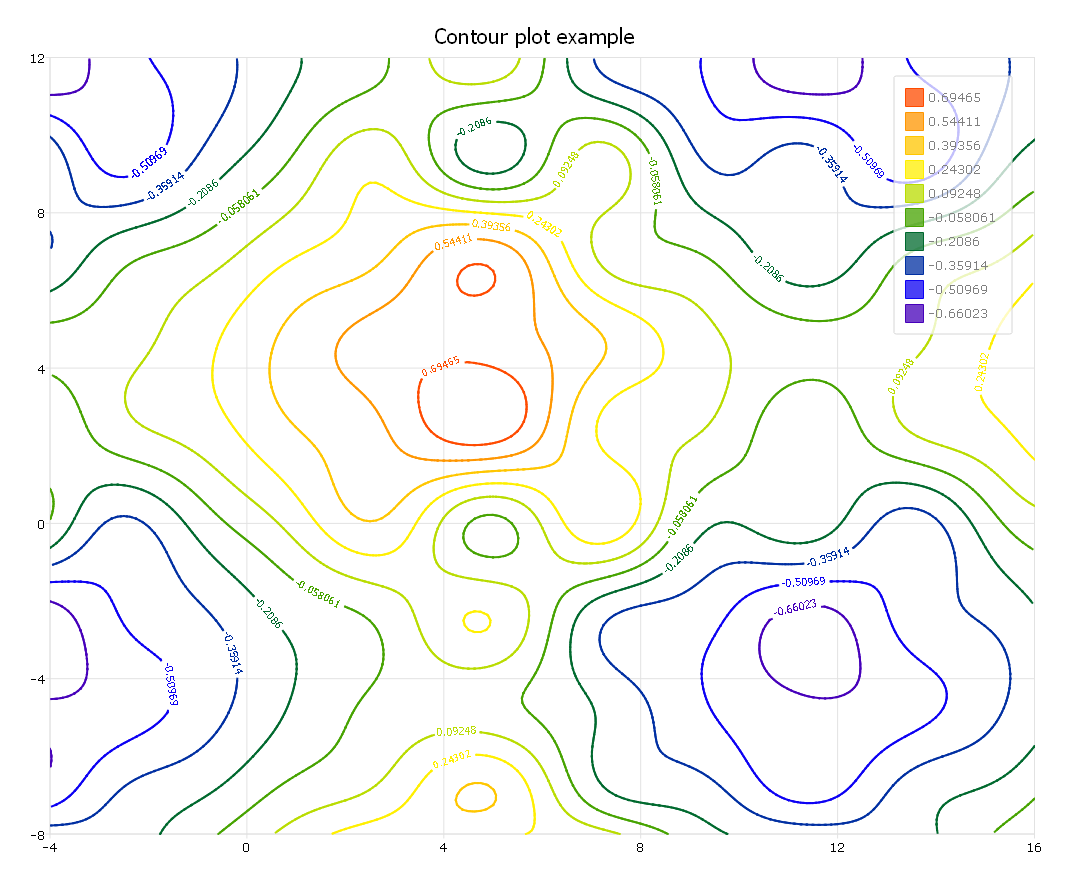
plotContour(myPlot, x, y, z);
The plot is
Remarks#
Note
This function sets an attribute in a plotControl structure. It does not
affect an existing graph, or a new graph drawn using the default
settings that are accessible from the
menu.
See also
Functions plotGetDefaults(), plotSetColorMap(), plotSetZLevels()