plotAddVLine#
Purpose#
Adds one or more vertical lines to an existing plot.
Format#
- plotAddVLine([myPlot, ]x)#
- Parameters:
myPlot (struct) – Optional argument. An instance of a
plotControlstructure.x (scalar or Nx1 vector) – the X coordinate(s) specifying where the vertical lines should be added.
Examples#
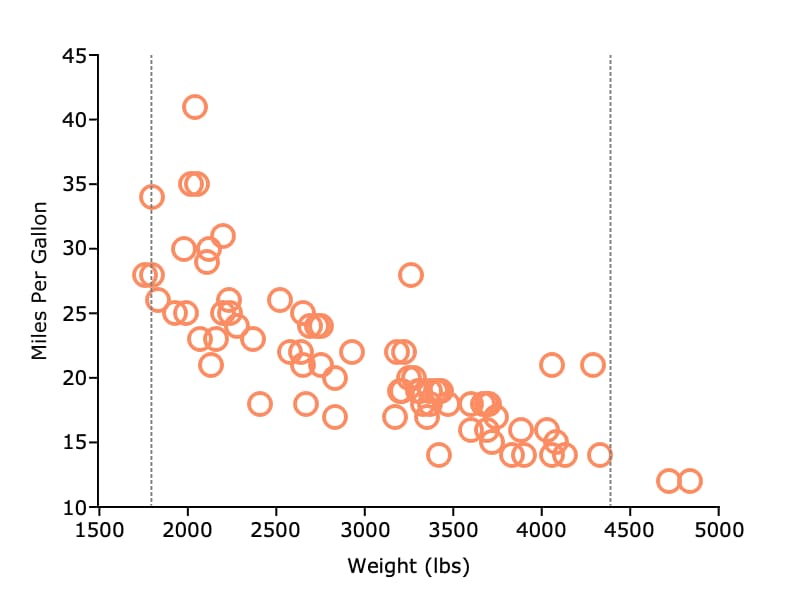
This example creates a scatter plot of two variables and adds vertical lines representing the 95% quantiles for the X variable.
// Create file name with full path
fname = getgausshome()$+"examples/auto2.dta";

// Load specified variables
auto = loadd(fname, "weight + mpg");

// Declare plotControl structure and
// fill with default settings for scatter
struct plotControl plt;
plt = plotGetDefaults("scatter");

plotSetXLabel(&plt, "Weight (lbs)");
plotSetYLabel(&plt, "Miles Per Gallon");

// Draw scatter plot
plotScatter(plt, auto[.,"weight"], auto[.,"mpg"]);

/*
** Add vertical line at the 95% confidence interval for weight
*/

// Compute percentiles of 'weight' variable
pct = quantile(auto[.,"weight"], 0.025 | 0.975);

// Set line to be gray, 1 pixel wide
// and to have 'dot'=3 style
plotSetLinePen(&plt, 1, "gray", 3);

// Draw line
plotAddVLine(plt, pct);
Remarks#
Each set of lines added with a call to
plotAddVline()will have the same line color, thickness and style.If a legend label is added, all lines from a single call to
plotAddVLine()will share one legend entry.See the entry for
plotAddHLine()to see an example with more than one line style and legend entry.
Please note that plotAddVLine() will add lines to existing graphs, it
will not create a new graph if one does not exist. plotAddVLine() is not
yet supported for surface plots.
See also
Functions plotAddHLine(), plotAddVBar()