plotSetLegendBorder#
Purpose#
Controls the color and thickness of the legend border.
Format#
- plotSetLegendBorder(&myPlot, clr[, thickness, style])#
- Parameters:
&myPlot (struct pointer) – A
plotControlstructure pointer.clr (string) – name or rgb value of the new color.
thickness (scalar) – Optional input, the thickness of the legend border in pixels.
style (scalar) –
Optional input, border line style. Options include:
1
solidSolid line.
2
dashDash line.
3
dotDot line.
4
dashdotDash-Dot line.
5
dashdotdotDash-Dot-Dot line.
Examples#
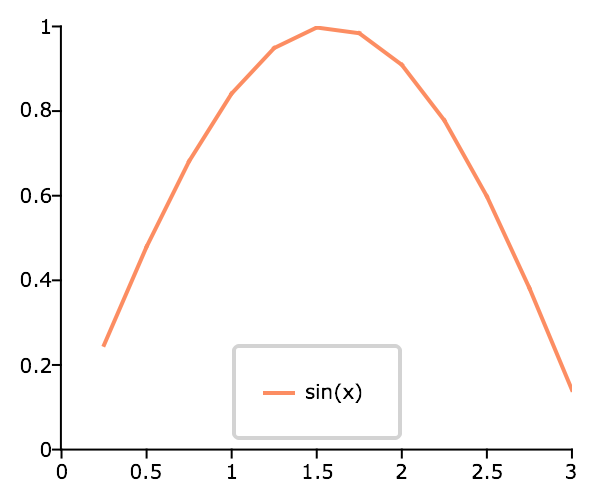
// Create the sequence 0.25, 0.5, 0.75...3
x = seqa(0.25, 0.25, 12);
y = sin(x);

// Declare plotControl structure
// and fill with default settings for XY plots
struct plotControl myPlot;
myPlot = plotGetDefaults("xy");

plotSetLegend(&myPlot, "sin(x)", 1|0.25);

// Set the legend border to light gray
// and 2 pixels thick
plotSetLegendBorder(&myPlot, "light gray", 2);

plotXY(myPlot, x, y);
Remarks#
You can hide the legend border by either setting it to the background color or using
plotSetLegendBkd()to make the legend background transparent.plotSetLegendBorder()is supported for use with all plot types except for PQG graphics andplotSurface().
Note
This function sets an attribute in a plotControl structure. It does not
affect an existing graph, or a new graph drawn using the default
settings that are accessible from the
menu.
See also
Functions plotSetLegend(), plotSetLegendBkd(), plotSetLegendFont()