plotSetYGridPen#
Purpose#
Controls the thickness, color, and style for the y-axis grid lines.
Format#
- plotSetYGridPen(&myPlot, which_grid, thickness[, clr[, style]])#
- Parameters:
&myPlot (struct pointer) – A
plotControlstructure pointer.which_grid (string) – The grid to modify,
"major","minor", or"both".thickness (Scalar) – the thickness of the specified y-axis grid lines in pixels.
clr (string) – Optional argument, name or rgb value of the new color for the specified y-axis grid lines.
style (Scalar) –
the style of the pen. Options include:
1
solidSolid line.
2
dashDash line.
3
dotDot line.
4
dashdotDash-Dot line.
5
dashdotdotDash-Dot-Dot line.
Examples#
// Declare plotControl structure
struct plotControl myPlot;
// Initialize plotControl structure
myPlot = plotGetDefaults("scatter");
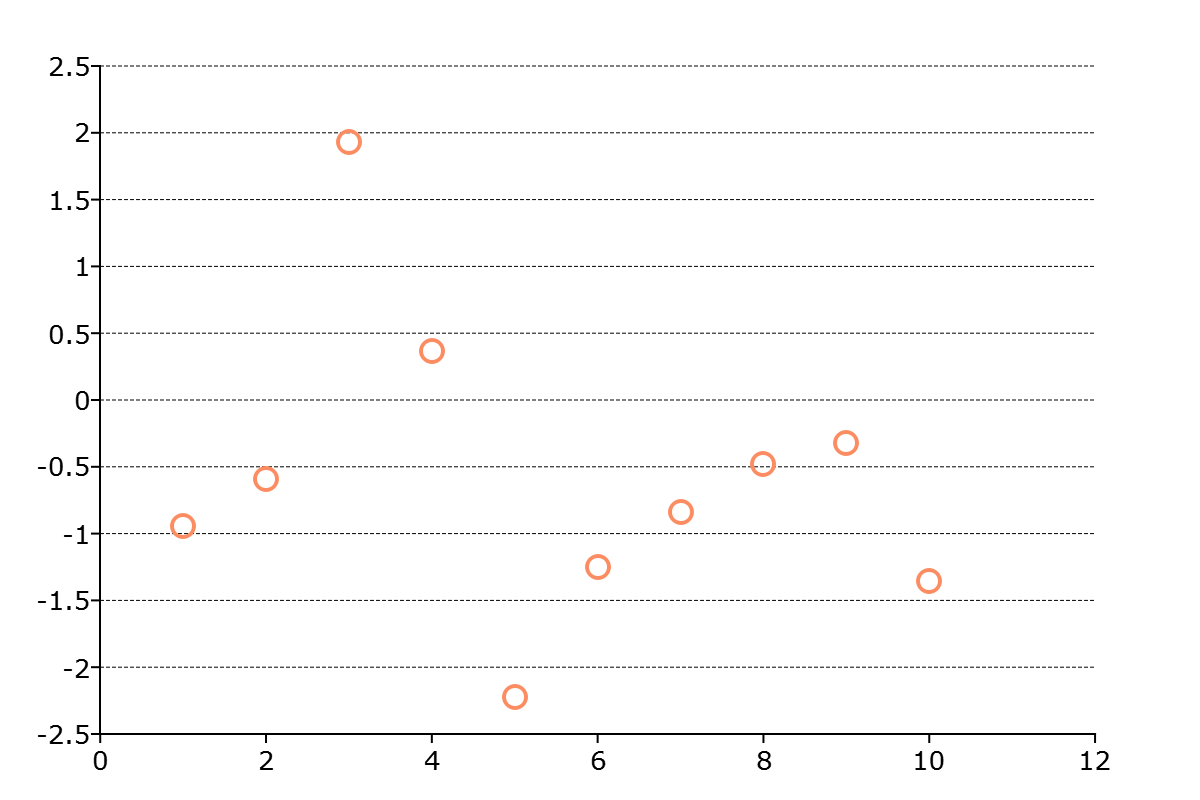
// Set grid line to be 0.5 px, black, and dashed
plotSetYGridPen(&myPlot, "major", 0.5, "Black", 2);
// Create a scatter plot of random data
plotScatter(myPlot, seqa(1, 1, 10 ), rndn(10, 1));
Remarks#
Note
This function sets an attribute in a plotControl structure. It does not
affect an existing graph, or a new graph drawn using the default
settings that are accessible from the
menu.
The axis updated by this function is determined by the value previously specified by plotSetActiveY(). The accepted values are "left" (default), "right", and "both".
Future calls to plotSetActiveY() will not retroactively change the values of a previously modified axis.
See also
Functions plotSetActiveY(), plotSetGridPen(), plotSetXGridPen()