plotSetYticLabel#
Purpose#
Controls the formatting and angle of y-axis tick labels.
Format#
- plotSetYticLabel(&myPlot, fmt[, angle])#
- Parameters:
&myPlot (struct pointer) – A
plotControlstructure pointer.fmt (string or 2x1 string array) – the desired formatting for the y-axis tick labels. If a 2x1 string array is passed in, the first element of fmt will control the left y-axis and the second element will control the right y-axis.
sprintf()style formatting strings are supported. See Remarks below for more information.angle (Scalar) – Optional argument, the angle in degrees at which to display the y-axis tick labels.
Examples#
Basic usage#
// Declare and initialize plotControl structure
struct plotControl myPlot;
myPlot = plotGetDefaults("scatter");

x = seqa(0, 0.005, 33);
y = exp(x);

// Set the Y-tick format to be decimal
// with three places after the decimal point,
// i.e. 1.050, 1.010, etc, for all tick labels
plotSetYticLabel(&myPlot, "%.3f");

// Draw the scatter plot
plotScatter(myPlot, x, y);
The code above produces a graph with Y-tick labels like the image below:
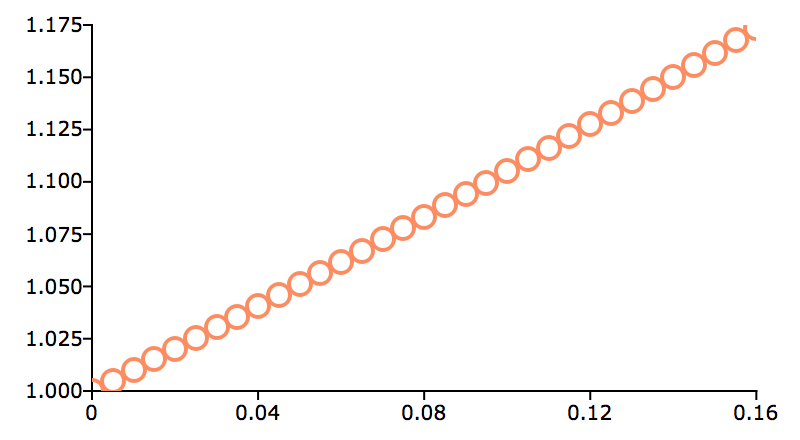
Y-tick labels#
Changing to format string to "%g" will change the labels to appear like this:
1.175
1.15
1.125
1.1
1.075
1.05
1.025
Changing to format string to "%.3e" will change the labels to appear like this:
1.175e+00
1.150e+00
1.125e+00
1.100e+00
1.075e+00
1.050e+00
1.025e+00
Left and right y-axis formatting.#
// Create 2 vectors to plot
temperature = { 14,
                31,
                27,
                19,
                22 };

pct = { 6.3,
        10.4,
        13.2,
        80.7,
        28.5 };

X = seqa(1, 1, 5);

// Declare plotControl structure and fill
// with default values for 'xy' plots
struct plotControl myPlot;
myPlot = plotGetDefaults("xy");

// Use the left y-axis for the first line
// and the right y-axis for the second line
plotSetWhichYAxis(&myPlot, "left" $| "right");

/*
** Set the format for the tick labels
** of each y-axis
**
** "%d°" - Print the numbers as integers, followed by
**             the degree symbol (° is HTML).
**
** "%.1f%%" - Print one number after the decimal, followed by
**            a percent sign.
*/

fmt =  "%d°" $| /* format for left y-axis */
      "%.1f%%";     /* format for right y-axis */

plotSetYTicLabel(&myPlot, fmt);

// Draw the plot using the settings applied above
plotXY(myPlot, X, temperature ~ pct);
This will give axes labels which look similar to below:
Left y-axis 32°    Right y-axis 90.0%
            28°                 80.0%
Remarks#
The parameters of a sprintf() style format string are:
precision - a literal scalar numeral, the number of digits after the decimal point
format type - one of the following letters:
d
integer
e
scientific notation
f
floating point/decimal
g
either scientific or decimal, whichever is most compact
The format of the format string is:
"%.<precision><format type>"
Below are some examples of different format strings and how they would represent \(\pi\)
“%.2f” |
3.14 |
“%.4f” |
3.1415 |
“%.2e” |
3.14e+00 |
“%.2g” |
3.14 |
“%d” |
3 |
Note
This function sets an attribute in a plotControl structure. It does not
affect an existing graph, or a new graph drawn using the default
settings that are accessible from the
menu.
See also
Functions dttostr(), strtodt(), plotSetYLabel(), plotSetXTicInterval(), plotSetTicLabelFont()