kernelDensity#
Purpose#
To compute kernel density estimate and plot.
Format#
- out = kernelDensity(dataset[, kernel, bw, c0])#
- out = kernelDensity(dataset, formula[, kernel, bw, c0])
- Parameters:
dataset (String) – Name of datafile, dataframe, or data matrix.
formula – Optional argument, formula string for loading variables from datafile. Default is to load all variables.
kernel (Scalar) –
Optional argument, type of kernel. Default = 1.
1
Normal.
2
Epanechnikov.
3
Biweight.
4
Triangular
5
Rectangular.
6
Truncated normal.
7
Parzen.
8
Cosine.
9
Triweight.
10
Tricube.
11
Logistic.
12
Sigmoid.
13
Silverman.
If kernel is scalar, the kernel is the same for all parameters. Default = Normal density.
bw (Scalar, Vector, or Matrix) – Optional argument, smoothing coefficient (bandwidth). Should be ExE compatible with the dataset. If
bwis scalar, the smoothing coefficient will be the same for every data observation. Ifbwis zero, optimal smoothing coefficient will be computed. Ifbw`is a matrix, the smoothing coefficient will be different for each observation. Default = 0.c0 (Structure) –
Instance of
kernelDensityControlstructure containing the following members:c0.varNames
String array, variable name(s). Default is dataframe headers if included,
"X1","X2", … otherwise.c0.NumPoints
Scalar, number of points to be computed for plots.
c0.EndPoints
Kx2 matrix, lower (in first column) and upper (in second column) endpoints of density. Default is minimum and maximum, respectively, of the parameter values. If 1x2 matrix, endpoints will be the same for all parameters.
c0.Truncate
Kx2 matrix, lower (in first column) and upper (in second column) truncation limits for truncated normal kernel. If 1x2 matrix, truncations limits will be the same for all plots. Default is minimum and maximum, respectively.
c0.plotFunctionPtr
Scalar, a pointer to a user-defined function used to specify format modifications to the default plot format.
c0.plotOff
Scalar, an indicator to turn plotting off. Set to 1 to turn off plotting. Default = 0.
- Returns:
out (Structure) –
Instance of
KernelDensityResultsstructureout.px
Matrix, abscissae.
out.py
Matrix, ordinates.
out.sm
Kx1, or Nxk, or Nx1 smoothing coefficients.
Examples#
Basic usage with dataframe#
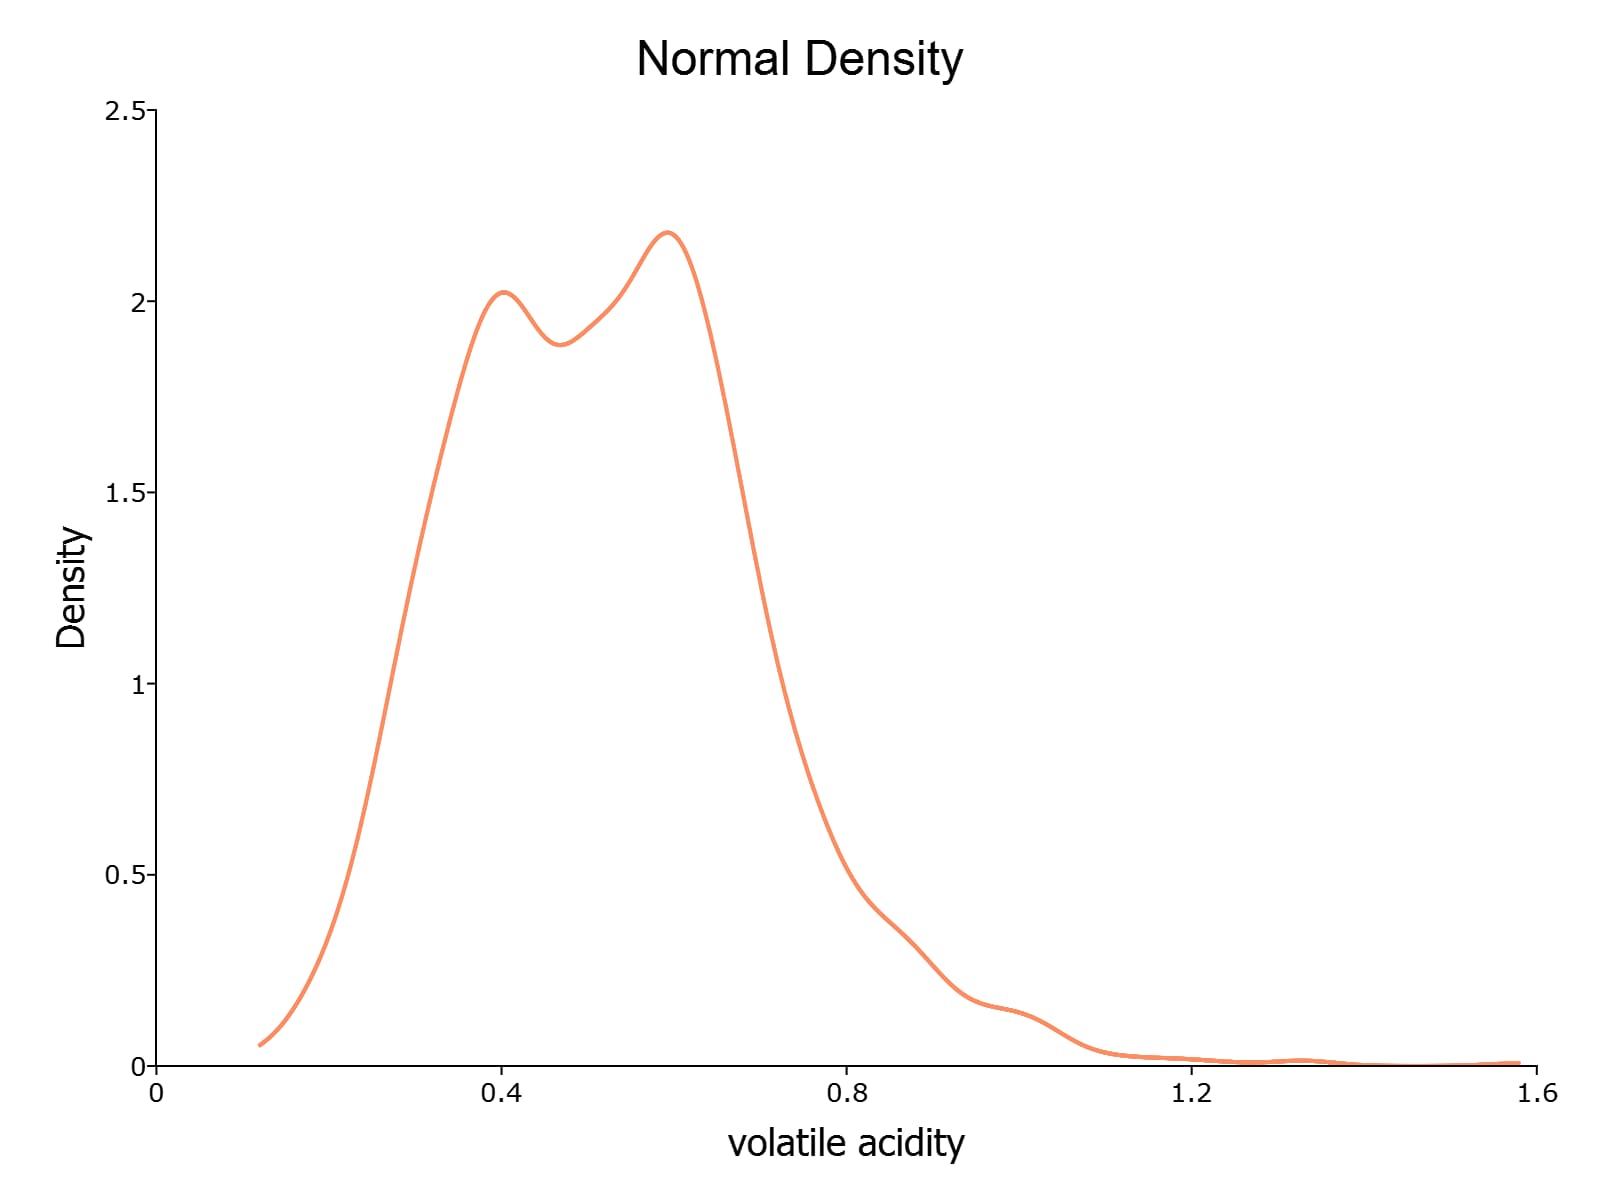
/*
** Example One:
** Basic usage
*/

// Load data
fname = getGAUSSHome("examples/winevolatileacidity.csv");
data = loadd(fname);

// Call kernelDensity function
// with default normal density
struct kernelDensityResults krslt1;
krslt1 = kernelDensity(data[., "volatile acidity"]);
Basic usage with filename#
/*
** Example Two:
** Basic usage with filename
*/

// Load data
fname = getGAUSSHome("examples/winevolatileacidity.csv");

// Call kernelDensity function
// with default normal density
call kernelDensity(fname, "volatile acidity");
Basic usage with multiple kernels#
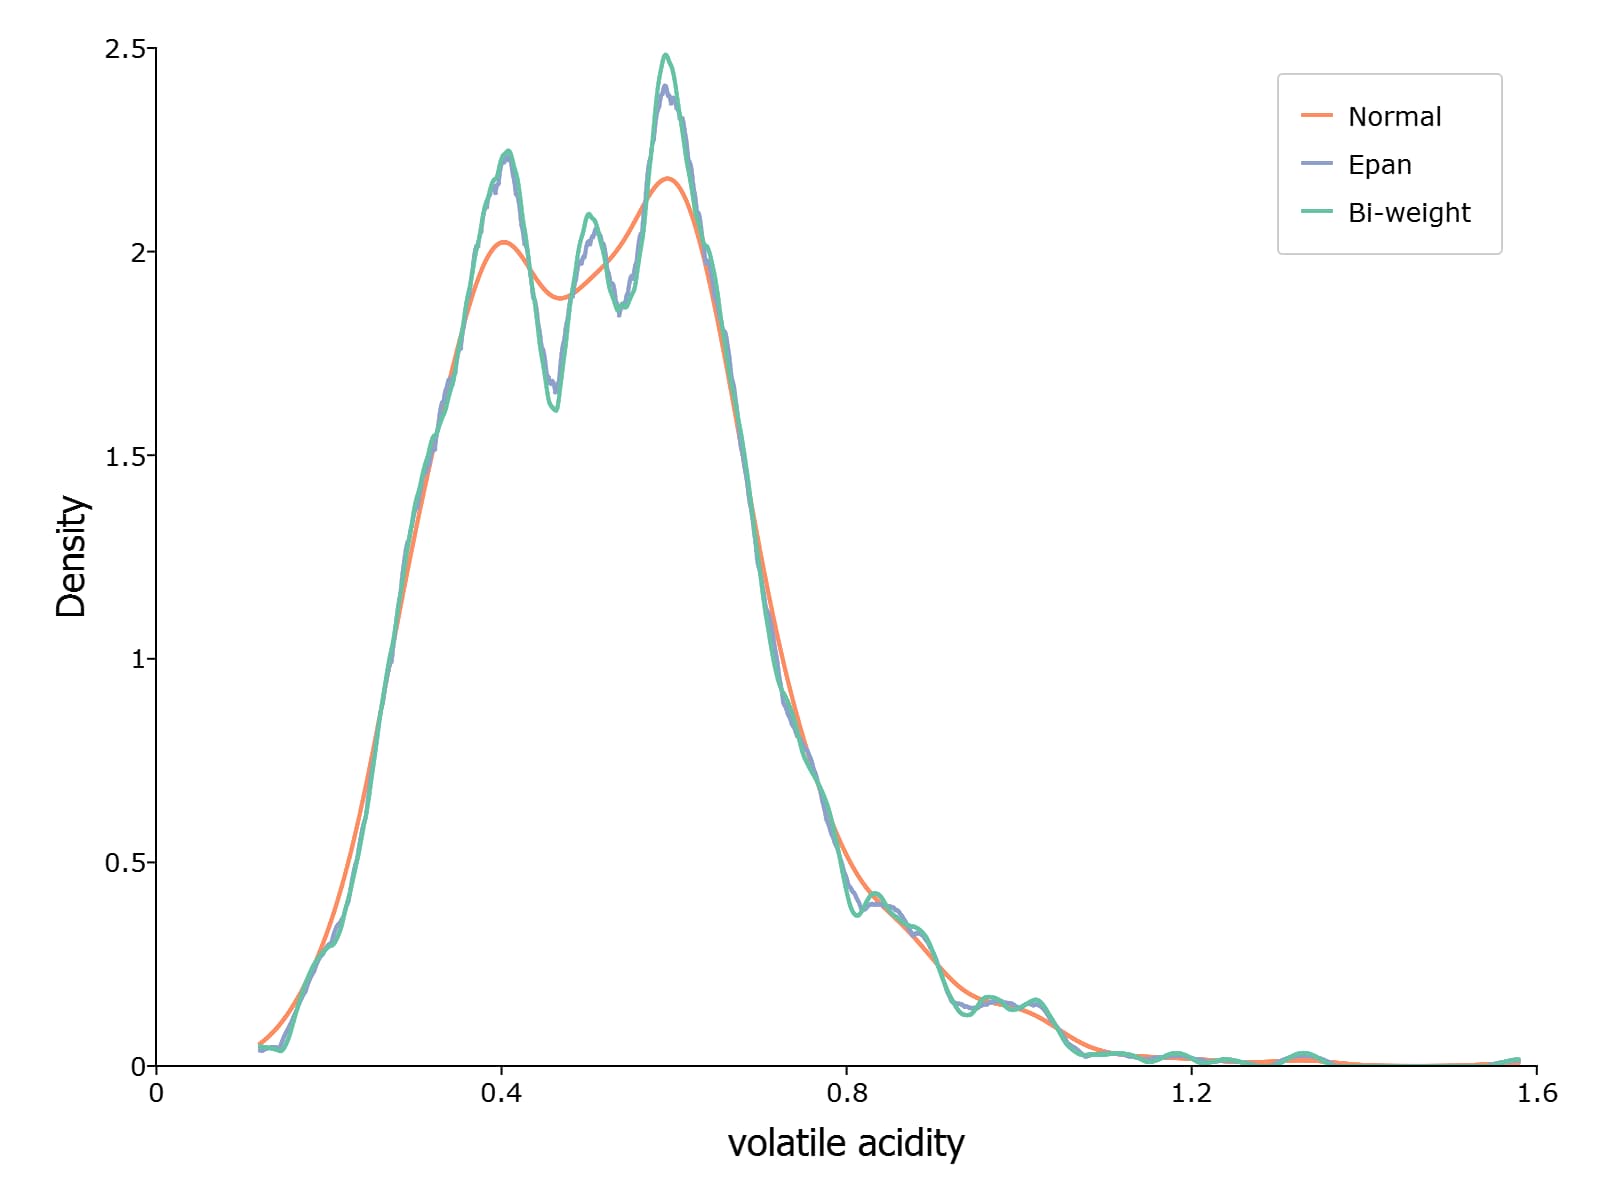
/*
** Example Three:
** Multiple kernels
** on same plot
*/

struct kernelDensityResults krslt2;
krslt2 = kernelDensity(data[., "volatile acidity"], 1|2|3);
Basic usage with multiple series#
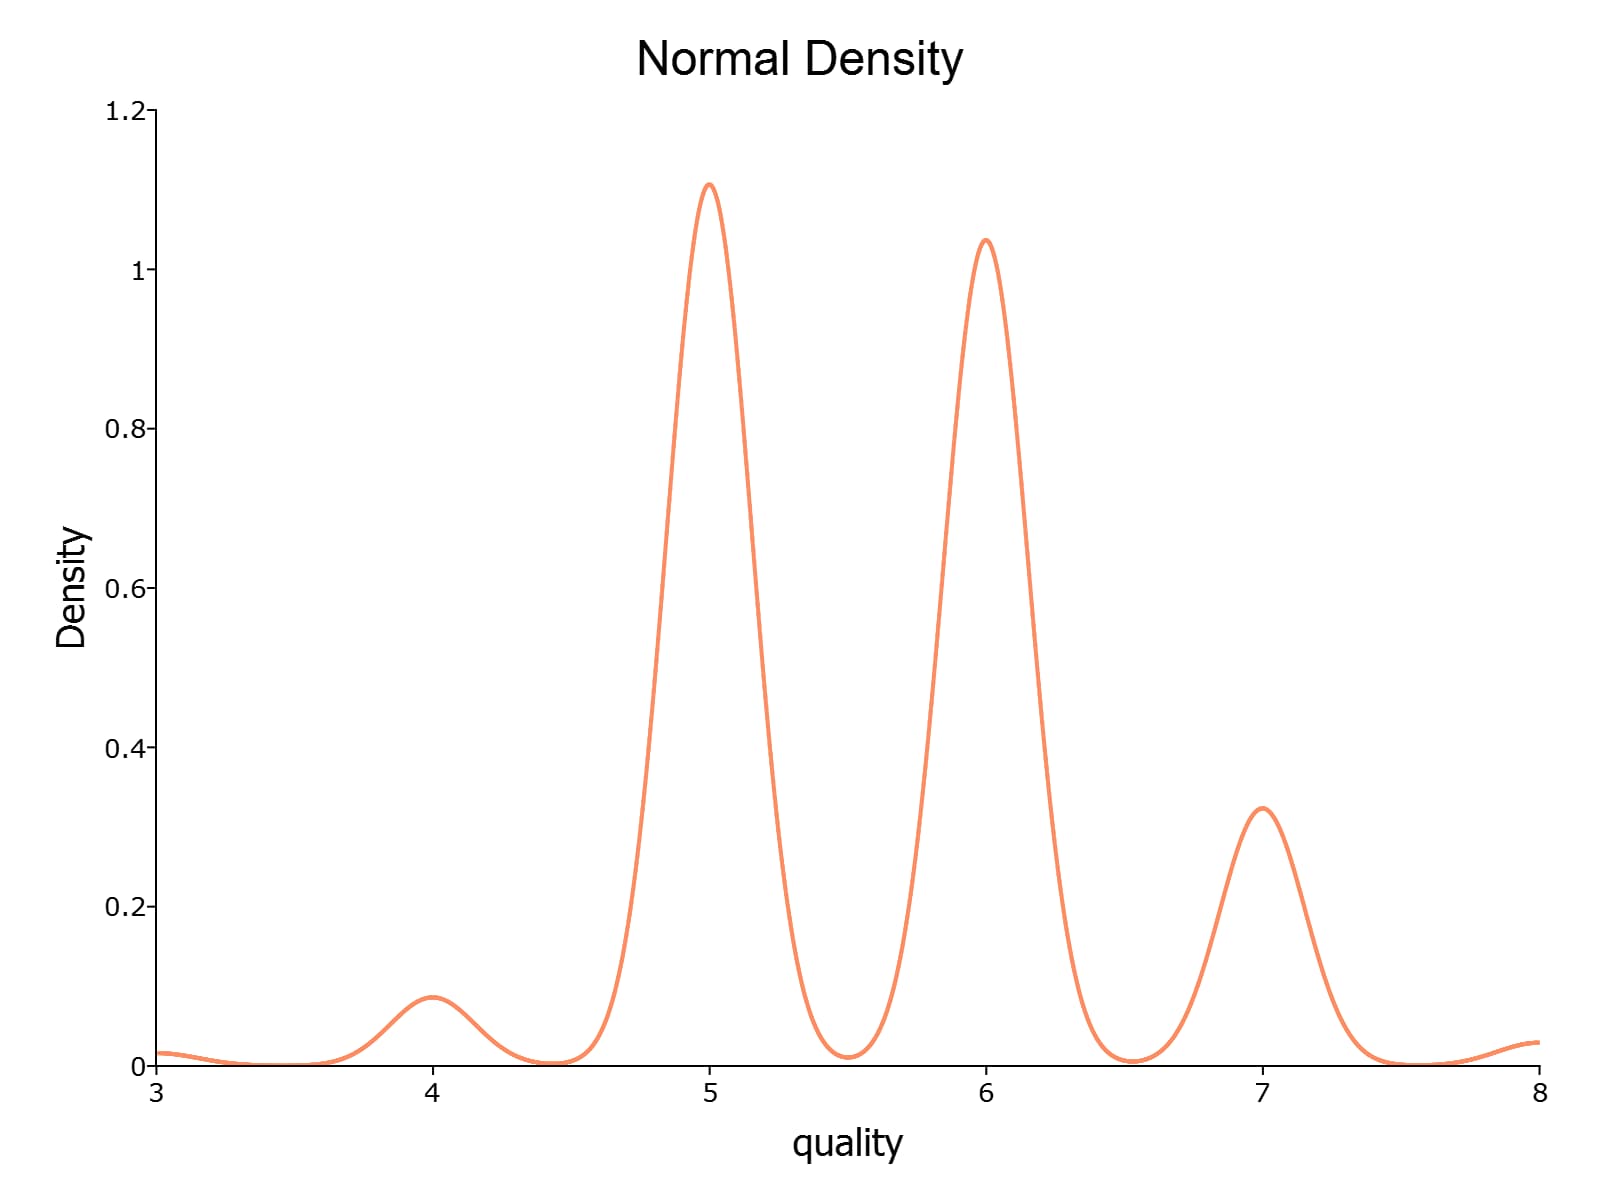
/*
** Example Four:
** Multiple series on different plots
*/

struct kernelDensityResults krslt3;
krslt3 = kernelDensity(data, 1);

Modifying plot with custom plotControl setting function#
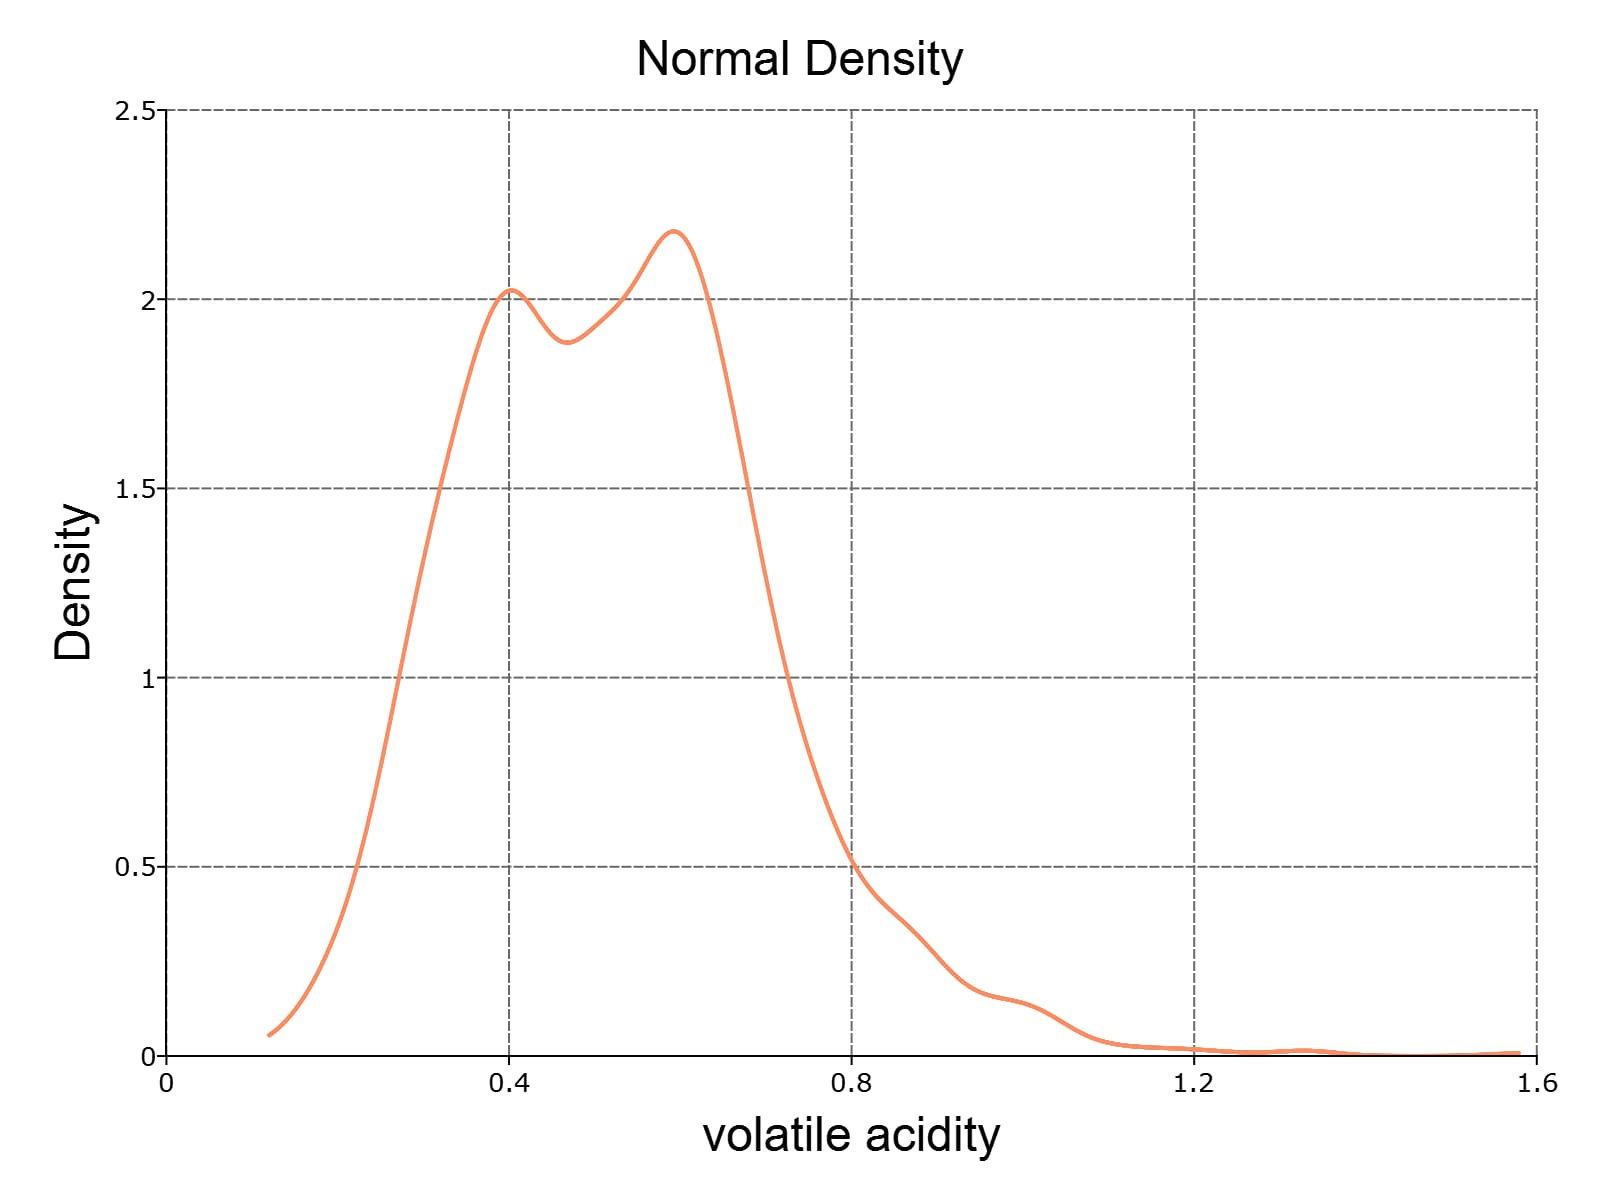
/*
** Example Five:
** Modifying plot
*/

struct kernelDensityControl kctl;
kctl = kernelDensityControlCreate();

// The ampersand (&) in front of the function
// name makes it a pointer to the function
kctl.plotFunctionPtr = &myPlotCustomizations;

// Basic example of kernel density plot customization
proc (1) = myPlotCustomizations(struct plotControl myPlot);

  // Set size for graph canvas
  plotCanvasSize("px", 800|600);

  // Turn on and style major grid lines
  plotSetGridPen(&myPlot, "major", 1, "dimgray", 2);

  //Return modified plotControl structure
  retp(myPlot);

endp;

// Set kernel to normal
kernel = 1;

// Automatically compute bandwidth
bw = 0;

// Call kernelDensity with
// control structure
struct kernelDensityResults krslt4;
krslt4 = kernelDensity(data[., "volatile acidity"], kernel, bw, kctl);
Remarks#
The x axis label will be set to the name of the column of the dataframe passed to
kerneldensity(). Usesetcolnames()to modify the name of the variable