plotSetFill#
Purpose#
Sets the fill style, transparency and color for scatter symbols, area plots, histograms and bar graphs.
Format#
- plotSetFill(&myPlot, fillType[, opacity_pct[, colors]])#
- Parameters:
&myPlot (struct pointer) – A
plotControlstructure pointer.fillType (Nx1 vector) –
vector where N is the number of bar styles to set.
0
No fill
1
Solid
2
Dense 1
3
Dense 2
4
Dense 3
5
Dense 4
6
Dense 5
7
Dense 6
8
Horizontal lines
9
Vertical lines
10
Cross pattern
11
B diagonal pattern
12
F diagonal pattern
13
Diagonal Cross
opacity_pct (scalar) – Optional argument, between 0 and 1. The percent opacity of the fill.
colors (string array) – Optional argument, color names or HTML hex value colors.
Examples#
// Declare plotControl structure
struct plotControl myPlot;
// Initialize plotControl structure
myPlot = plotGetDefaults("bar");
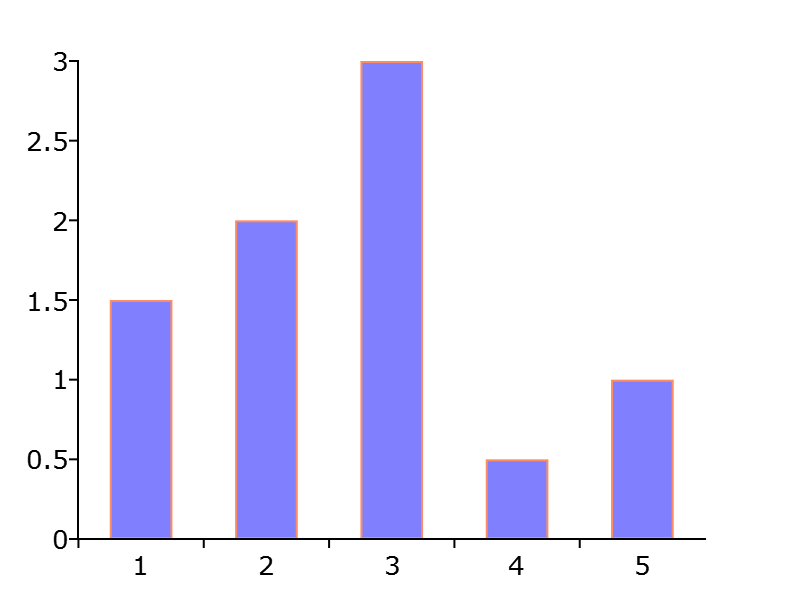
// Set all bars to have a solid, blue, fill, with 50% opacity
textures = 1;
plotSetFill(&myPlot, textures, 0.5, "blue");
// Create data
x = seqa(1, 1, 5);
y = { 1.5, 2, 3, 0.5, 1 };
// Draw bar graph
plotBar(myPlot, x, y);
Remarks#
When graphing without the use of a plotControl structure, these settings
may be chosen by selecting from the main menu.
See also
Functions plotBar(), plotAddVBar(), plotHist()