plotSetXRange#
Purpose#
Sets the range for the x-axis.
Format#
- plotSetXRange(&myPlot, x_min, x_max[, tic_interval, first_labeled])#
- plotSetXRange(&myPlot, x_min, x_max[, tic_interval, time_unit, first_labeled])
- Parameters:
&myPlot (struct pointer) – A
plotControlstructure pointer.x_min (Scalar, or 2x1 matrix) – minimum limit of the x-axis.
x_max (Scalar, or 2x1 matrix) – maximum limit of the x-axis.
tic_interval (scalar) – Optional input, the distance between x-axis tick labels.
time_unit (string) –
Optional input used for time series plots. The time units to describe the
tic_intervalinput:”milliseconds”
”seconds”
”minutes”
”hours”
”days”
”months”
”quarters”
”years”
first_labeled (scalar) – Optional input, the value of the first X value on which to place a tick label.
Examples#
Basic usage#
// Declare plotControl structure
struct plotControl myPlot;

// Initialize plotControl structure
myPlot = plotGetDefaults("scatter");

// Set x-axis to to range from -5 to +5
plotSetXRange(&myPlot, -5, 5);

// Create and plot data using our x-range
x = rndn(100, 1);
y = rndn(100, 1);

plotScatter(myPlot, x, y);
Set separate ranges for the top and bottom x-axes#
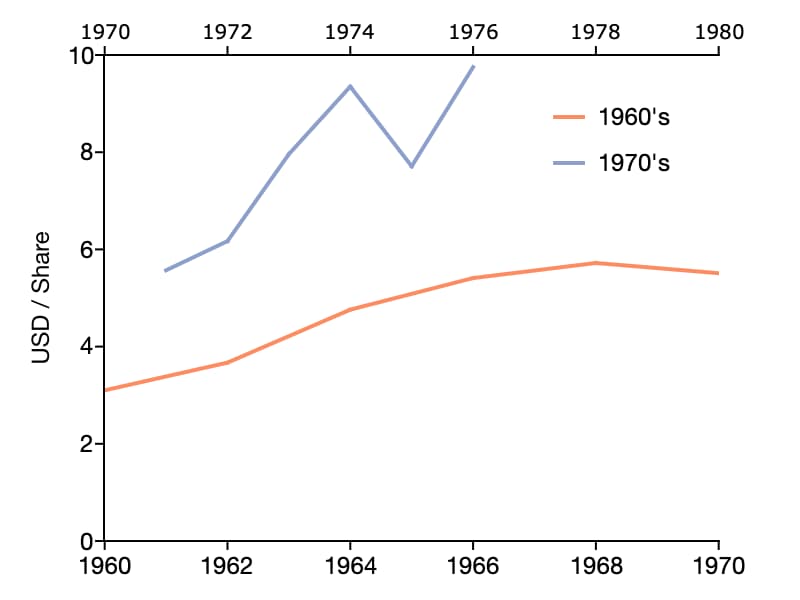
We will create the plot shown above, comparing S&P 500 earnings data from two decades by plotting one of the series against the bottom x-axis and the other against the top x-axis.
The call to plotSetWhichXAxis() below specifies that the first column plotted will be assigned to the bottom x-axis, while the second column plotted will be plotted against the top x-axis.
// Declare plotControl structure
// and apply default settings
struct plotControl myPlot;
myPlot = plotGetDefaults("xy");

// S&P500 earnings data
y60s = { 1960, 1962, 1964, 1966, 1968, 1970 };
y70s = { 1971, 1972, 1973, 1974, 1975, 1976 };

earn60s = { 3.1, 3.67, 4.76, 5.41, 5.72, 5.51 };
earn70s = { 5.57, 6.17, 7.96, 9.35, 7.71, 9.75 };

// Set the range for the bottom x-axis from 1960 to 1970
// and set the range for the top x-axis from 1970 to 1980
x_min = { 1960, 1970 };
x_max = { 1970, 1980 };
plotSetXRange(&myPlot, x_min, x_max);

// Assign the 1st column (which will be the 1960's data) to the bottom x-axis.
// Assign the 2nd column (1970's data) to the top x-axis
plotSetWhichXAxis(&myPlot, "bottom" $| "top");

plotSetLegend(&myPlot, "1960's"$|"1970's");

plotSetYRange(&myPlot, 0, 10);
plotSetYLabel(&myPlot, "USD / Share");

// Draw plot with 60's data as the first column and
// the 70's data second to be consistent with the
// above call to plotSetWhichXAxis
plotXY(myPlot, y60s~y70s, earn60s~earn70s);
Remarks#
If
x_minorx_maxare scalar values, they will apply to the top and bottom x-axis. If they are 2x1 matrices, the first element will control the bottom x-axis and the second will control the top x-axis.
Note
This function sets an attribute in a plotControl structure. It does not
affect an existing graph, or a new graph drawn using the default
settings that are accessible from the
menu.
See also
Functions plotSetXShow(), plotSetYRange()