plotAddArea#
Purpose#
Adds a cumulative area plot to an existing graph.
Format#
- plotAddArea([myPlot, ]x, y[, base])#
- Parameters:
myPlot (struct) – Optional argument, a
plotControlstructure.x (Nx1 vector) – the X coordinates
y (Nx1 or NxM matrix) – Each column contains the height for the corresponding section of the graph. If y contains more than one column, each column will be stacked on top of the previous column.
base (scalar) – Optional argument. The height for the base of the added area plot. The default value is zero.
plotAddArea()does not yet support a vector input for base.
Examples#
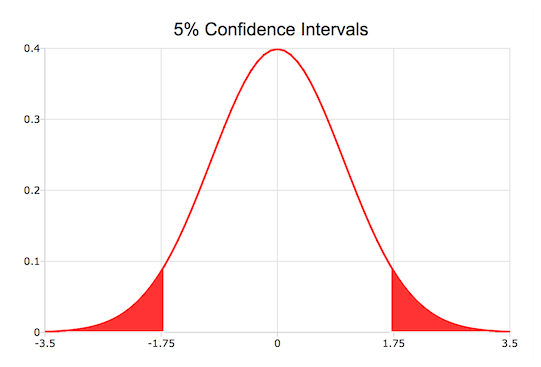
Creating confidence intervals#
// Create the 'x' and 'y' for the normal
// probability density function
x = seqa(-3.5, 0.1, 71);
y = pdfn(x);

// Create the 'x' and 'y' points
// for the left tail
edge = cdfni(0.05);
x_ci = selif(x, (x .< edge));
y_ci = y[1:rows(x_ci)];

// Set colors
struct plotControl myPlot;
myPlot = plotGetDefaults("xy");

clr = getColorPalette("accent", 3);

plotSetLineColor(&myPlot, clr[3]);


plotSetFill(&myPlot, 1, 1, clr[3]);

// Draw filled in left tail
plotArea(myPlot, x_ci, y_ci);

// Create the 'x' and 'y' points
// for the right tail
edge = cdfni(0.95);
x_ci = selif(x, (x .> edge));
y_ci = y[rows(y)-rows(x_ci)+1:rows(y)];

// Add right tail to graph
plotAddArea(myPlot, x_ci, y_ci);

// Add pdfn line
plotSetLineSymbol(&myPlot, -1);
plotAddXY(myPlot, x, y);
The code to create the graph below can be found in the file plotaddci.e in your GAUSS examples directory.
Creating confidence intervals with plotAddArea()
Remarks#
plotAddArea() may only add curves to 2-D graphs.
This function will not change any of the current graph’s settings other than to resize the view as necessary to display the new curve.
See also
Functions plotAddBar(), plotAddHist(), plotAddHistF(), plotAddHistP(), plotAddPolar(), plotXYFill()