plotAddHLine#
Purpose#
Adds a horizontal line to an existing plot.
Format#
- plotAddHLine([myPlot, ]y)#
- Parameters:
myPlot (struct) – Optional argument. An instance of a
plotControlstructure.y (scalar or Nx1 vector) – the Y coordinate(s) specifying where the horizontal lines should be added.
Examples#
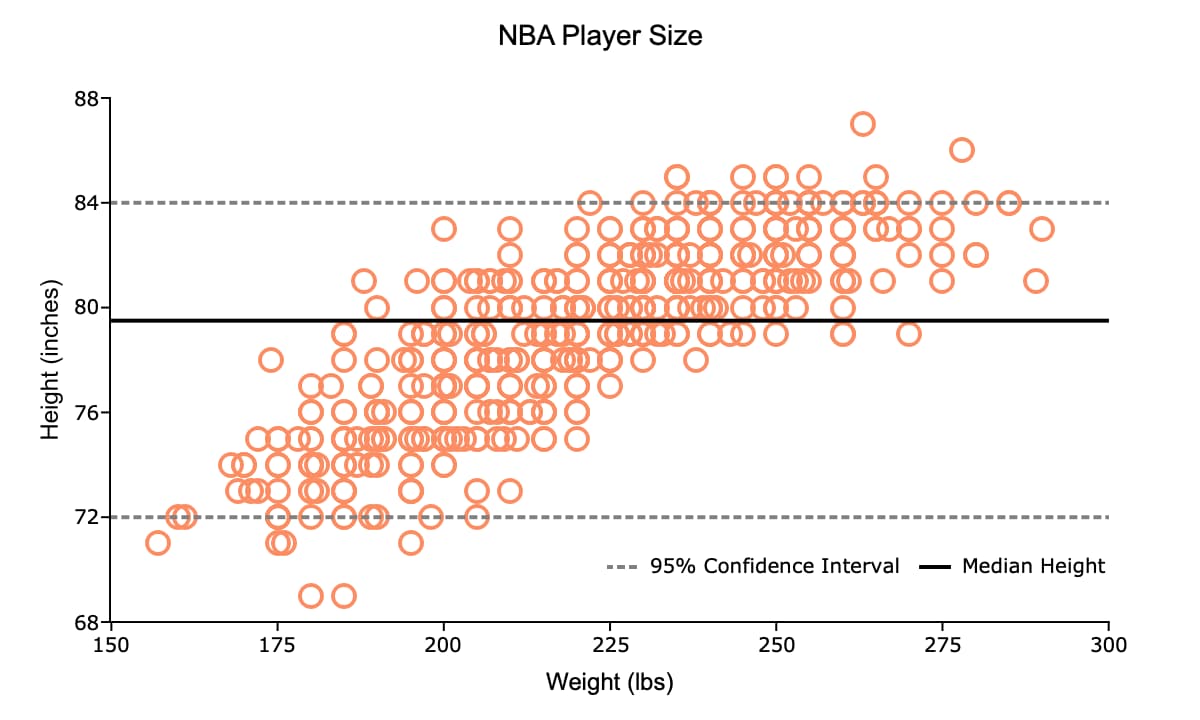
This example creates a scatter plot of two variables and adds horizontal lines representing the 95% confidence interval and the median for the Y variable.
// Create file name with full path
dataset = getGAUSSHome("examples/nba_ht_wt.xls");

// Load variables from the Excel file
nba = loadd(dataset, "Height + Weight");

// Declare plotControl structure and
// fill with default settings
struct plotControl plt;
plt = plotGetDefaults("scatter");

plotSetTitle(&plt, "NBA Player Size", "Arial", 14);

plotSetXLabel(&plt, "Weight (lbs)", "Arial", 12);
plotSetYLabel(&plt, "Height (inches)");


// Draw scatter plot
plotScatter(plt, nba[.,"Weight"], nba[.,"Height"]);


// Compute quantiles to add to graph
qtls = quantile(nba[.,"Height"], 0.025|0.5|0.975);

/*
** Set up line style for the
** horizontal lines we will add
*/
clr = "gray" $| "black";
styles = { 3 /* dot   */,
           1 /* solid */ };
plotSetLinePen(&plt, 2, clr, styles);

/*
** Set up legend
*/
legend_labels = "95% Confidence Interval" $| /* Label for first set of h-lines */
                "Median Height";             /* Label for final h-line */

// Place top-left corner of legend box at x=220, y=72
// The final input, 0, makes legend lined up horizontally
plotSetLegend(&plt, legend_labels, 220|72, 0);

// Turn off legend border
plotSetLegendBorder(&plt, "white", 0);

// Add gray lines with dot styling
plotAddHLine(plt, qtls[1 3]);

// Add black solid line
plotAddHLine(qtls[2]);
Notice that the line style and legend options are set after the call to plotScatter(). These settings are applied when the plotControl structure is passed in to the first call to plotAddHLine().
The second call to plotAddHLine() does not pass in a plotControl structure. Therefore, the second line color, line style and legend label settings are used for this line.
Remarks#
As shown in the above example, each set of lines added with a call to
plotAddHline()will have the same line color, thickness and style.If a legend label is added, all lines from a single call will share one legend entry.
Please note that plotAddHLine() will add lines to existing graphs, it
will not create a new graph if one does not exist. plotAddHLine() is not
yet supported for surface plots.
See also
Functions plotAddVLine(), plotAddHBar()