plotScatter#
Purpose#
Creates a 2-dimensional scatter plot.
Format#
- plotScatter([myPlot, ]x, y)#
- plotScatter([myPlot, ]df, formula)
- Parameters:
myPlot (struct) – Optional argument, a
plotControlstructure.x (Nx1 or NxM matrix) – Each column contains the X values for a particular data point.
y (Nx1 or NxM matrix) – Each column contains the Y values for a particular data point.
df (NxM dataframe.) – The data referenced by the formula string.
formula (string) –
formula string describing which variables to plot. E.g
"mpg ~ weight", will plotmpgalong the y-axis andweightalong the x-axis;E.g
"age + education ~ rating"will plotageandeducationalong the y-axis againstratingon the x-axis;E.g
"education ~ rating + by(gender)"will split the data by thegendervariable and then plot both groups witheducationalong the y-axis againstratingon the x-axis;
Examples#
Example 1: Formula string with the ‘by’ keyword#
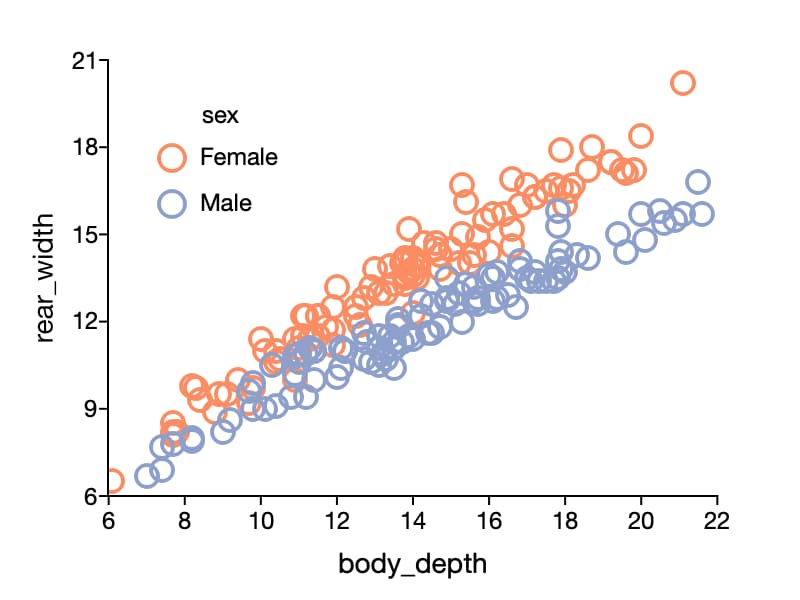
We can create the above image with the code below.
// Create file name with full path
fname = getGAUSSHome("examples/crabs.dta");

// Load all variables from the dataset
crabs = loadd(fname);

// Draw the scatter plot using your preference settings
plotScatter(crabs, "rear_width ~ body_depth + by(sex)");
Note that when using a formula string, the axis labels and legend are filled in automatically.
Example 2: Customized plot without formula string#
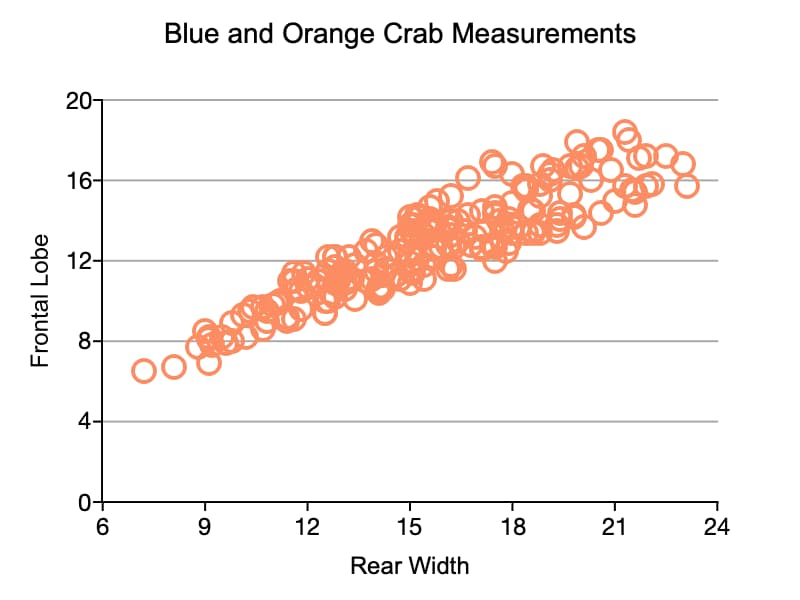
// Create file name with full path
fname = getGAUSSHome("examples/crabs.dta");

// Load all variables from the dataset
crabs = loadd(fname);

// Declare plt to be a plotControl structure
// and fill with default settings for scatter
struct plotControl plt;
plt = plotGetDefaults("scatter");

plotSetTitle(&plt, "Blue and Orange Crab Measurements", "arial", 14);

// Axis labels
plotSetYLabel(&plt, "Frontal Lobe", "arial", 12);
plotSetXLabel(&plt, "Rear Width");

// Span the Y range from 0 to 20
plotSetYRange(&plt, 0, 20);

// Draw Y-ticks every 4 units starting at 0
plotSetYTicInterval(&plt, 4, 0);

// Create grid lines coming from the major ticks
// on the Y axis and color them dark gray
plotSetYGrid(&plt, "major", "dark gray");

// Draw plot
plotScatter(plt, crabs[.,"rear_width"], crabs[.,"frontal_lobe"]);
See also
Functions plotXY(), plotLogLog(), plotBox(), plotHistP()