plotBarH#
Purpose#
Generates a horizontal bar graph.
Format#
- plotBarH([myPlot, ]labels, height)#
- Parameters:
myPlot (struct) – Optional argument, a
plotControlstructurelabels (Nx1 numeric vector or Nx1 string array) – bar labels. If scalar 0, a sequence from 1 to
rows(height)will be created.height (NxK numeric vector) – bar heights. K overlapping or side-by-side sets of N bars will be graphed.
Examples#
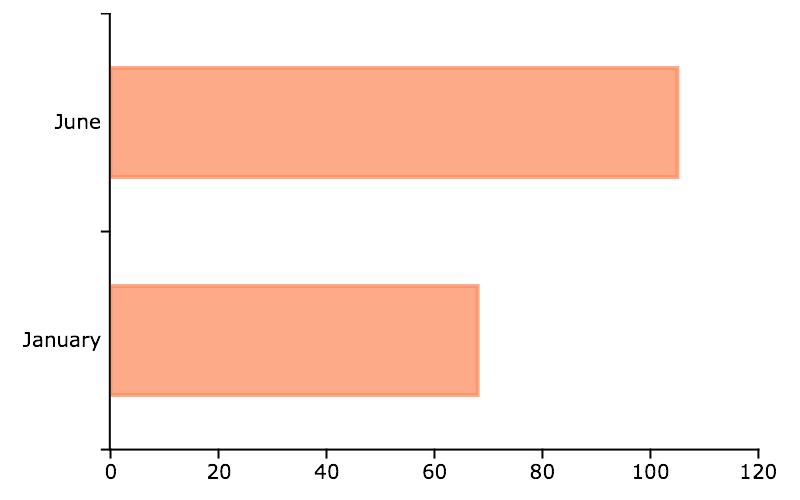
Basic example with string labels#
// Create data and labels
labels = "January" $| "June";
temp = { 68, 105 };

// Draw bar graph
plotBarH(labels, temp);
Basic example with numeric labels#
You may also pass in a numeric vector for the y-axis labels. This example will produce the a graph which looks the same as the graph above, except for the y-axis labels.
// Create data and labels
labels = { 4, 5 };
temp = { 68, 105 };

// Draw bar graph
plotBarH(labels, temp);
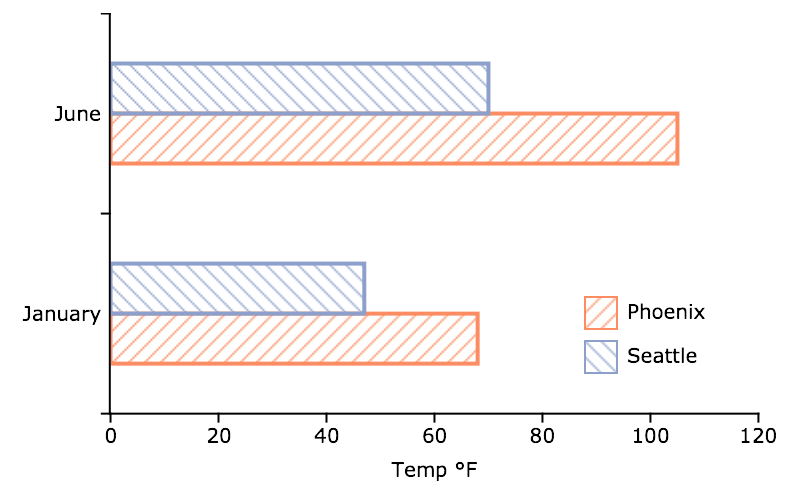
Customized horizontal bar plot#
new;

// Create 2x1 numeric vectors
seattle = { 47, 70 };
phoenix = { 68, 105 };

// Create 2x1 string labels
labels = "January" $| "June";

// Declare 'myPlot' to be a plotControl struct
// and fill with defaults settings for bar plots
struct plotControl myPlot;
myPlot = plotGetDefaults("bar");

// Create legend
leg_text = "Phoenix" $| "Seattle";
plotSetLegend(&myPlot, leg_text, "bottom right inside");

// Set legend border to zero pixels wide
plotSetLegendBorder(&myPlot, "gray", 0);

// Set Fill to different diagonal stripe patterns
// and 100% opacity
plotSetFill(&myPlot, 12|13, 1);

// Use HTML to create the degrees symbol
plotSetXLabel(&myPlot, "Temp °F");

// Concatenate temperature vectors
// into a 2x2 matrix
heights =  phoenix ~ seattle;

// Draw the graph
plotBarH(myPlot, labels, heights);
Remarks#
To control the color and texture of the bars as well as whether they are stacked or side by side:
If you are passing a
plotControlstructure to your graph, you may use the functionplotSetFill().If you are not passing a
plotControlstructure, these properties are set in the Preferences. To access the Graphics Preferences, select from the GAUSS main menu. Select Graphics on the left side of the preferences and then select Bar from the list of graph types.
plotSetBar()can be used to create stacked bar plots.
See also
Functions plotBar(), plotSetFill(), plotHistP()