plotAddTSHF#
Purpose#
Adds high-frequency and irregularly spaced time series data to an already existing plot.
Format#
- plotAddTSHF([myPlot, ]date_vec, y)#
- Parameters:
myPlot (Struct) – Optional argument, a
plotControlstructure.date_vec (Nx1 vector) –
containing the dates for each observation in the y . The dates in date_vec are required to be:
In POSIX time/date format i.e. seconds since Jan 1, 1970 (GAUSS dataframe date columns are automatically in this format).
Sorted, increasing.
However, the dates in date_vec may be:
Irregularly spaced
y (Nx1 or NxM matrix) – Each column contains the Y values for a particular line.
Examples#
Plot Forex tick data with custom X-tick labels#
// Create file name with full path
file = getGAUSSHome("examples/eurusd_tick.csv");
// Load dates as a string array from the first column of the file
dt_psx = loadd(file, "date");
// Use first 20 obs only
dt_psx = dt_psx[1:20];
// Load bid and ask data
y = loadd(file, "bid + ask");
y = y[1:rows(dt_psx), .];
// Set the size of the graph
plotCanvasSize("px", 600 | 400);
// Declare plotControl structure
// and fill with default settings
struct plotControl myPlot;
myPlot = plotGetDefaults("xy");
plotSetFonts(&myPlot, "all", "arial", 14);
plotSetTitle(&myPlot, "EUR/USD Octobter 31st 2008");
// Set legend text
plotSetLegend(&myPlot, "bid" $| "ask", "top left inside");
// Make legend background transparent
plotSetLegendBkd(&myPlot, 0);
// Create an X-tick label every 10 seconds
// Set the first tick label at:
// October 31st, 2008 at 51 minutes and 50 seconds after midnight
first_label = asdate("2008-10-31 12:51:50");
plotSetXTicInterval(&myPlot, 10, first_label, "seconds");
// Set the format for the tick label.
// You can add literal text like AM, by
// enclosing it in single-ticks
plotSetXTicLabel(&myplot, "HH:MM:SS 'AM'");
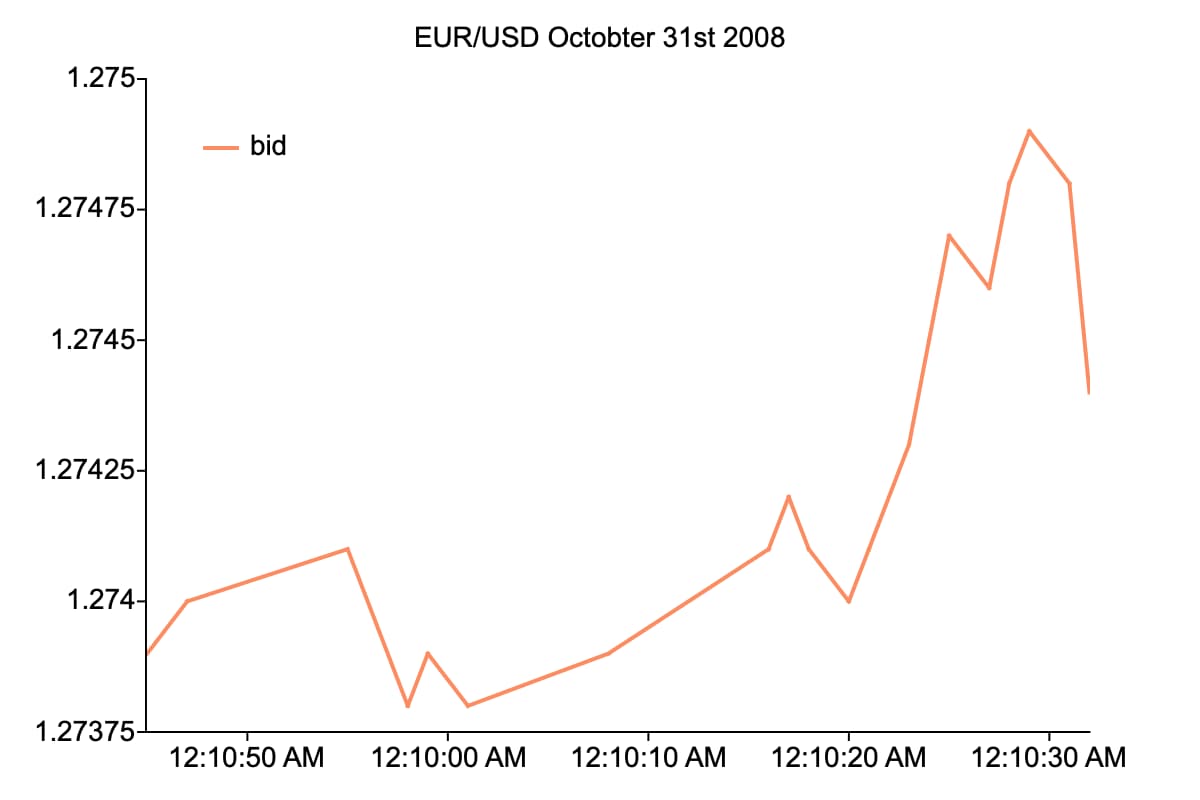
// Draw bids on graph
plotTSHF(myPlot, dt_psx, "seconds", y[ ., "bid"]);
The above code will produce:
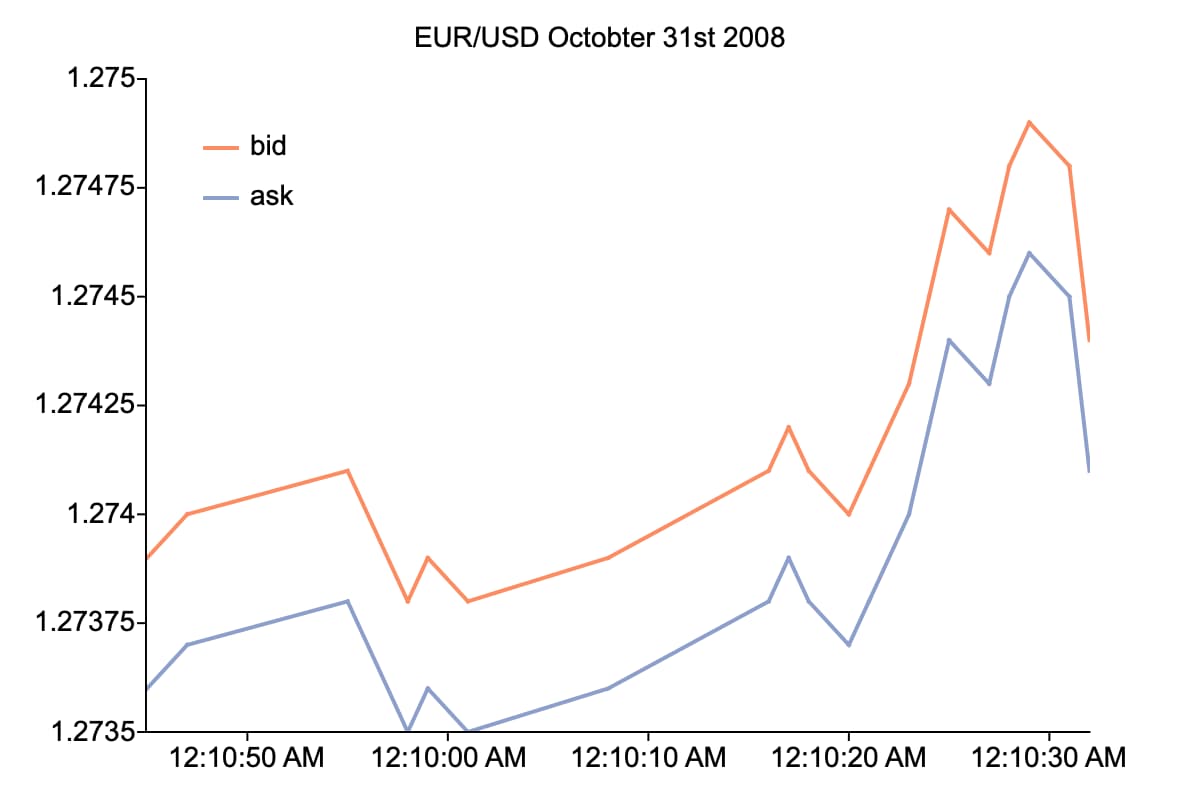
// Add asks on graph
plotAddTSHF(dt_psx, y[., "ask"]);
The above code will add the ask data. Notice that it is added to the legend which we set up before the initial graph.
Remarks#
By default missing values in the y variable will be represented as gaps in the line.
See also
Functions plotTSHF(), plotSetXTicLabel(), plotSetXTicInterval(), plotScatter(), plotTS(), plotTSLog()