plotSetTextInterpreter#
Purpose#
Controls the text interpreter settings for a graph.
Format#
- plotSetTextInterpreter(&myPlot, interpreter[, location])#
- Parameters:
&myPlot (struct pointer) – A
plotControlstructure pointer.interpreter (string) –
"html","plain","latex".location (string) –
Optional argument, which attributes the interpreter change applies to :
Valid options:
”all” (default)
”legend”
”legend_title”
”title”
”axes”
”xaxis”
”xtop”
”xbottom”
”yaxis”
”yleft”
”yright”
Examples#
Plain interpreter#
The HTML text interpreter treats certain characters, such as greater-than and less-than signs, as mark-up rather than literal text to display. The Plain text interpretor will allow you to use these symbols directly in your plot text labels.
new;

// Declare plotControl structure
struct plotControl myPlot;

// Initialize plotControl structure
myPlot = plotGetDefaults("hist");

// Set the interpreter of axes
plotSetTextInterpreter(&myPlot, "plain", "axes");

// Set the x-axis label, using the > character which would
// would fail with the default HTML interpreter.
plotSetXLabel(&myPlot, "Weight > 50 Kg");

// Create data
x = rndn(1e5, 1);

// Plot a histogram of the x data spread over 50 bins
plotHist(myPlot, x, 50);
HTML interpreter#
You may add Greek letters, mathematical symbols, subscript and superscript to your title, axes and legend using HTML. To add HTML to a label, you can use plotSetTextInterpreter() to set “html” for the text to be interpreted as HTML.
// Set the interpreter of axes
plotSetTextInterpreter(&myPlot, "html", "axes");

label_string = "β";

// Set the x-axis label
plotSetXLabel(&myPlot, label_string);
The code above will add the letter \(\beta\) to the graph title. The HTML ‘sup’ tag will create superscript and the ‘sub’ tag will create subscript. For example:
label_string = "σ<sup>2</sup>";
// Set the x-axis label
plotSetXLabel(&myPlot, label_string);
will add \(\sigma^2\) to your title. While,
label_string = "Y<sub>t-1</sub>";

// Set the x-axis label
plotSetXLabel(&myPlot, label_string);
will create \(Y_{t-1}\).
LaTeX Interpreter#
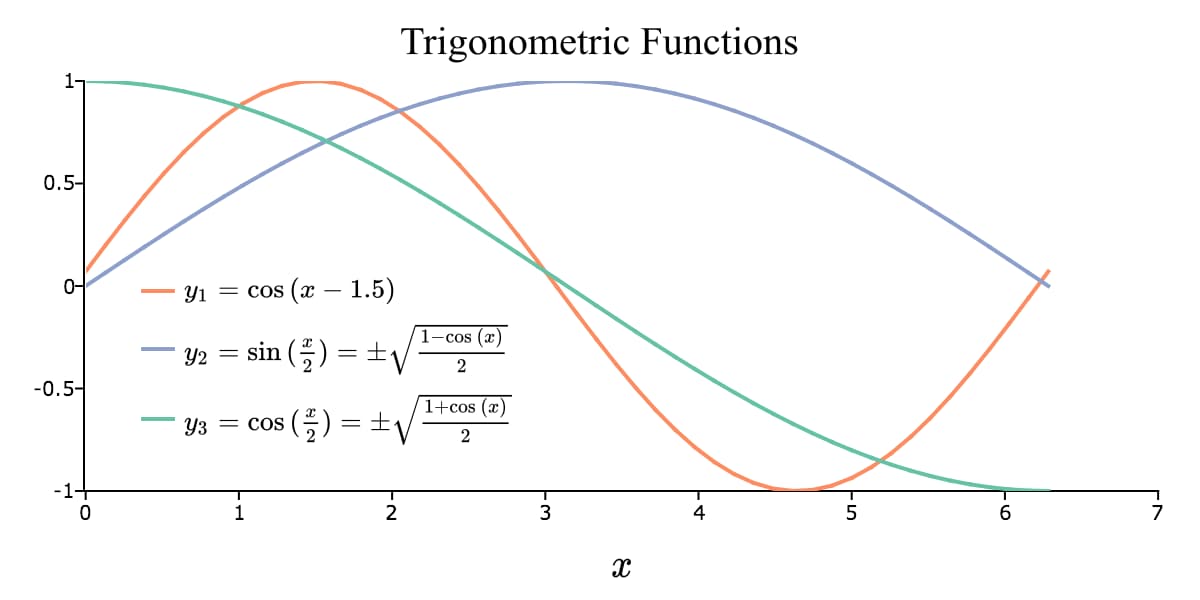
You can also use LaTeX to add complex math expression, or non-Latin scripts to your title, axes, and legend. You can use plotSetTextInterpreter() to set “latex”for the text to be interpreted as LaTeX.
new;

// Declare plotControl structure
// and fill with default XY settings
struct plotControl myPlot;
myPlot = plotGetDefaults("xy");

// Set LaTeX text interpreter for all text on plot
plotSetTextInterpreter(&myPlot, "latex", "all");

font_name = "Times New Roman";

// Set up x-axis label
plotSetXLabel(&myPlot, "x", font_name, 20);

// Set LaTeX legend string
string legend_string = {
"y_1 = \\cos{(x - 1.5)}",
"y_2 = \\sin{(\\frac{x}{2})} = \\pm \\sqrt{\\frac{1-\\cos{(x)}}{2}}",
"y_3 = \\cos{(\\frac{x}{2})} = \\pm \\sqrt{\\frac{1+\\cos{(x)}}{2}}"};

plotSetLegend(&myPlot, legend_string, "bottom left inside", 1);
plotSetLegendBkd(&myPlot, 0);
plotSetLegendFont(&myPlot, font_name, 12);

// Set up title
title_string = "\\text{Trigonometric Functions}";
plotSetTitle(&myPlot, title_string, font_name, 18);

// Create data
n = 50;
x = seqa(0,(2*pi)/(n-1), n);

// Specify size of plot canvas
plotCanvasSize("px", 600 | 300);

// Draw plot
plotXY(myPlot, x, cos(x-1.5)~sin(x/2)~cos(x/2));
The plot is
Remarks#
When the text interpreter is set to use LaTeX:
Since backslashes inside of a string represent the escaping of a character, use double backslashes to represent a backslash.
The default mode is that of an in-line equation. To add a section of strictly text, wrap the text only section in
\\text{}. For example:"\\text{The formula is } \\alpha + \\beta_1 X + \\epsilon"
Text outside of a
\\text{}section will use the TeX font. Text inside of a\\text{}section will use whatever font was specified for the label.
The plain text interpreter will allow you to pass in characters that
would be invalid HTML, such as the symbols ‘<’ and ‘>’.
Note
This function sets an attribute in a plotControl structure. It does not
affect an existing graph, or a new graph drawn using the default
settings that are accessible from the
menu.
See also
Functions plotGetDefaults(), plotSetYLabel(), plotSetXLabel(), plotSetTitle(), plotSetLegend()