plotCDFEmpirical#
Purpose#
Plots the cumulative distribution function (cdf) of the empirical distribution.
Format#
- plotCDFEmpirical([myPlot, ]x[, bins])#
- Parameters:
myPlot (struct) – Optional argument, a
plotControlstructurex (Nx1 vector) – data
bins (scalar or vector) – Optional input. If scalar, evenly spaced vector between x_min and x_max sized equal number of bins is used to find the empirical cdf. If vector, GAUSS uses the passed vector as the values at which to find empirical cdf.
Examples#
new;
cls;
rndseed 2223;
// Create a random vector
x = rndn(30, 1);
// Sort x for the first column
x = sortc(x, 1);
// Get empirical cdf of x
{ f, bk_points } = cdfEmpirical(x);
// Add negative infinity (__INFN) for probability equal to 0.
print (__INFN|x)~f;
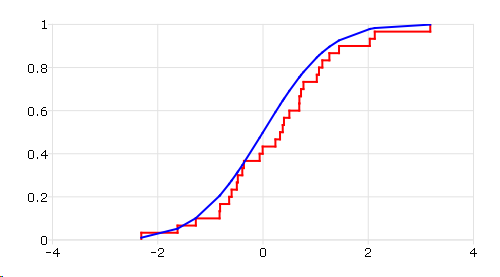
// Plot empirical distribution
plotCDFEmpirical(x);
// Get normal cdf of x
f2 = cdfN(x);
// Plot theoretical distribution
plotADDXY(x, f2);
After above code,
         -INF       0.00000000
   -2.3124206      0.033333333
   -1.6240227      0.066666667
   -1.2763153       0.10000000
  -0.82532512       0.13333333
  -0.81574278       0.16666667
  -0.64338729       0.20000000
  -0.59625173       0.23333333
  -0.49725006       0.26666667
  -0.47855430       0.30000000
  -0.39340284       0.33333333
  -0.36201638       0.36666667
 -0.063830011       0.40000000
-0.0064523646       0.43333333
   0.23570074       0.46666667
   0.32355136       0.50000000
   0.37501508       0.53333333
   0.39847826       0.56666667
   0.50039685       0.60000000
   0.68900341       0.63333333
   0.69132515       0.66666667
   0.72246796       0.70000000
   0.76893134       0.73333333
    1.0221019       0.76666667
    1.0638924       0.80000000
    1.1274880       0.83333333
    1.2610791       0.86666667
    1.4445086       0.90000000
    2.0295113       0.93333333
    2.1240430       0.96666667
    3.1784008        1.0000000
The plot is
See also
Functions cdfEmpirical()