plotSetYTicPosition#
Purpose#
Controls if the y-axis tick is inside or outside the y-axis line.
Format#
- plotSetYTicPosition(&myPlot, position)#
- Parameters:
&myPlot (struct pointer) – A
plotControlstructure pointer.position (string) – Position of the ticks. Options: [
"outside","inside","hidden"].
Examples#
// Declare plotControl structure
struct plotControl myPlot;
// Initialize plotControl structure
myPlot = plotGetDefaults("xy");
// Set ticks to be inside the plot
plotSetYTicPosition(&myPlot, "inside");
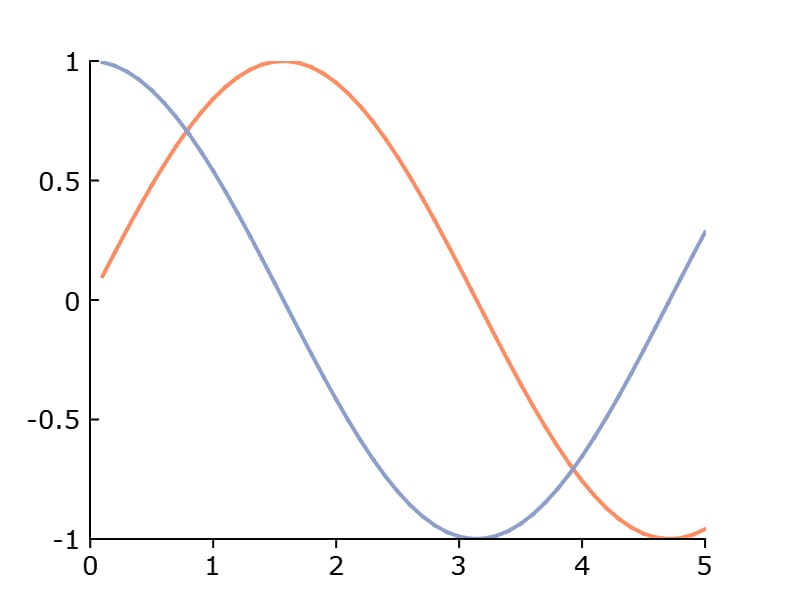
// Create data
x = seqa(0.1, 0.1, 50);
y = sin(x)~cos(x);
// Plot the data with the new line colors
plotXY(myPlot, x, y);
Remarks#
Note
This function sets an attribute in a plotControl structure. It does not
affect an existing graph, or a new graph drawn using the default
settings that are accessible from the
menu.
See also
Functions plotSetXTicPosition(), plotSetAxesTicPosition()