plotACF#
Purpose#
Plot the autocorrelations function (ACF).
Format#
- plotACF([myPlot, ]x, k, d)#
- Parameters:
myPlot (struct) – Optional argument, a
plotControlstructure for acfx (Nx1 vector) – data.
k (scalar) – maximum number of autocorrelations to compute.
d (scalar) – order of differencing.
Examples#
// Clear out variables in GAUSS workspace
new;
// Create file name with full path
file = getGAUSSHome("examples/beef_prices.csv");
// Import dataset starting with row 2 and column 2
x = csvReadM(file, 2, 2);
// Max lags
k = 20;
// Order of differencing
d = 1;
// ACF plot
struct plotControl mp;
mp = plotGetDefaults("bar");
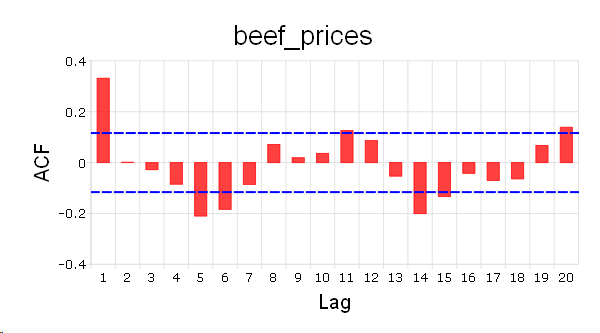
plotSetTitle(&mp, "beef_prices", "Arial", 20);
plotACF(mp, x, k, d);
The plot is:
Remarks#
To control the color and texture of the bars as well as whether they are stacked or side by side:
If you are passing a plotControl structure to your graph, you may use
the function plotGetDefaults() and plotSetBar().
If you are not passing a plotControl structure, these properties are set
in the Preferences. To access the Graphics Preferences, select
from the GAUSS main menu. Select Graphics on
the left side of the preferences and then select Bar from the list
of graph types.
See also
Functions plotPACF(), ACF(), PACF()