plotSetBarWidth#
Purpose#
Sets the width of the bars in bar graphs.
Format#
- plotSetBarWidth(&myPlot, barWidth)#
- Parameters:
&myPlot (struct pointer) – A
plotControlstructure pointer.barWidth (Scalar) – Width of the bars in plot set between 0 and 1. If set to 1, the bars will touch each other. Default bar width is 0.5.
Examples#
new;
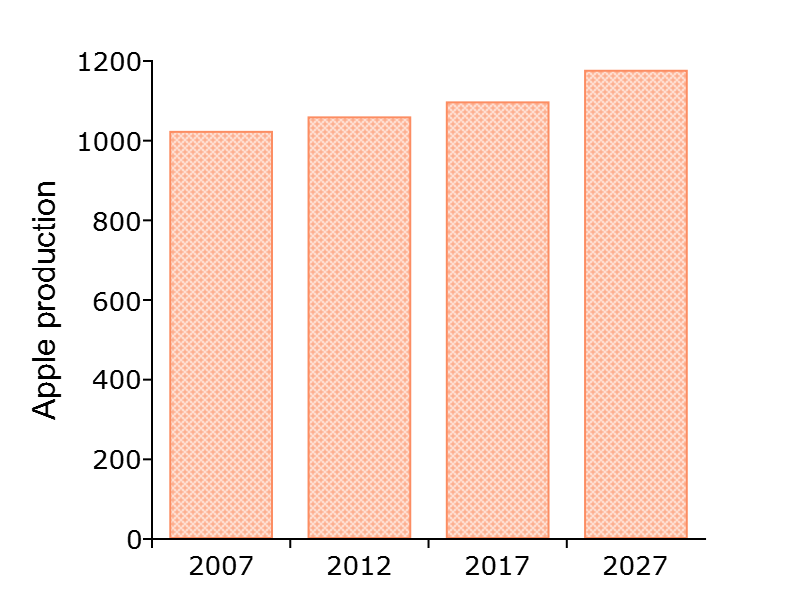
years = { 2007, 2012, 2017, 2027 };
y = { 1024.603,
1060.97,
1098.627,
1178 };
// Declare plotControl structure
// and fill in default values for bar plot
struct plotControl myPlot;
myPlot = plotGetDefaults("bar");
// Set style of bar fill pattern
plotSetBarFill(&myPlot, 4);
// Set title and axis labels
plotSetYLabel(&myPlot, "Apple production", "Arial", 12);
// Set canvas size for plot to 400 px by 300 px
plotCanvasSize("px", 400 | 300);
// Adjust bar size from 0.5 default to 0.75
plotSetBarWidth(&myPlot, 0.75);
// Draw plot
plotBar(myPlot, years, y);
// Set canvas size for next plots to fill available space
plotCanvasSize("fill");
Remarks#
This function controls the width between groups of bars. In the case of one bar per group, this will control the distance between the bars. If more than one bar is drawn per label, then the bars assigned to a specific label will touch each other, but plotSetBarWidth() will control the distance between the outside of each group and the other groups of bars.
When graphing without the use of a plotControl structure, these settings
may be chosen through the menu.
See also
Functions plotBar(), plotGetDefaults(), plotHist(), plotSetBar()