plotSetXTicLabel#
Purpose#
Controls the formatting and angle of x-axis tick labels.
Format#
- plotSetXTicLabel(&myPlot, fmt[, angle])#
- Parameters:
&myPlot (struct pointer) – A
plotControlstructure pointer.fmt (string) –
the desired formatting for the x-axis tick labels.
angle (scalar) – Optional argument, the angle in degrees at which to display the x-axis tick labels.
Examples#
Time series#
// Declare and initialize plotControl structure
struct plotControl myPlot;
myPlot = plotGetDefaults("xy");

y = rndn(5, 1);

plotSetXTicLabel(&myPlot, "YYYY-MO");

// Start the series in January 1982
dtstart = 198201;

// Specify the data to be monthly
frequency = 12;

// Draw the time series plot
plotTS(myPlot, dtstart, frequency, y);
The code above produces a graph with X-tick labels like the image below:
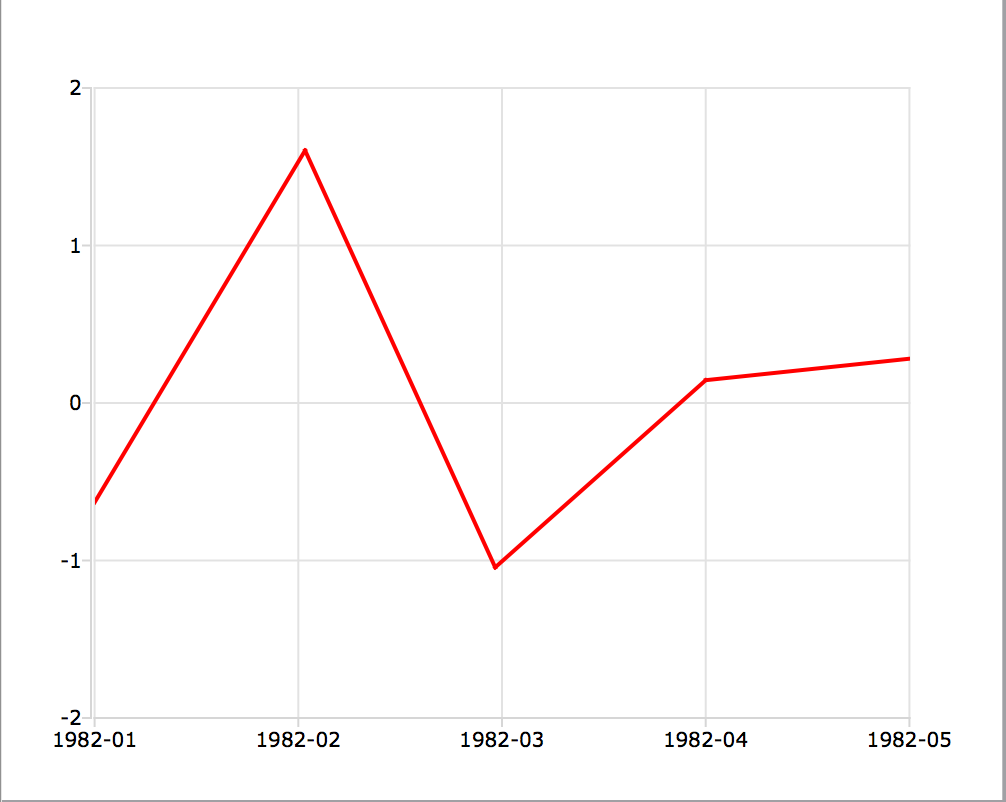
X-tick labels#
Changing to format string to "MO/YYYY" will change the labels to appear like this:
01/1982
Changing to format string to "YYYY-QQ" will change the labels to appear like this:
1982-Q1
Other than time series#
// Declare and initialize plotControl structure
struct plotControl myPlot;
myPlot = plotGetDefaults("xy");

x = seqa(0.015, 0.015, 10);
y = cos(x.^2);

plotSetXTicLabel(&myPlot, "%.3f");

// Draw the graph, using our format specifier
plotXY(myPlot, x, y);
The code above produces a graph with X-tick labels like the image below:
XY formatted label#
Remarks#
Time series format specifier#
The following format specifiers are supported for the second input to
plotSetXTicLabel(), fmt when the plot will be drawn withplotTS():YYYY
4 digit year
YR
Last two digits of year
QQ
Quarter of the year. This is calculated from the month number.
M
Number of month, 1-12
MO
Number of month, 01-12
MMM
The abbreviated localized month name (e.g. ‘Jan’ to ‘Dec’)
MMMM
The long localized month name (e.g. ‘January’ to ‘December’)
d
Number of day, 1-31
ddd
The abbreviated localized day name (e.g. ‘Mon’ to ‘Sun’)
dddd
The long localized day name (e.g. ‘Monday’ to ‘Sunday’)
DD
Day of month, 01-31
HH
Hour of day, 00-23
MI
Minute of hour, 00-59
SS
Second of minute, 00-59
Extra text may be added to a time series X-tick label, by enclosing it in single-ticks. For example,
plotSetXTicLabel(myPlot, "HH:MI 'PM'");
would add the text
PMto the end of the X-tick label, like this: 12:30 PM, or 02:15 PM. Note that the single-tick marks are not included as part of the label.To learn more about DT scalar format, see Date and Time Formats, Section 1.0.1, or the functions
dttostr()andstrtodt()
Format specifier for other graph types#
Graph types other than time series use a sprintf() style format string.
The parameters of the format string are:
precision - a literal scalar numeral, the number of digits after the decimal point
format type - one of the following letters:
d
integer
e
scientific notation
f
floating point/decimal
g
either scientific or decimal, whichever is most compact
The format of the format string is:
"%.<precision><format type>"
Below are some examples of different format strings and how they would represent \(\pi\)
“%.2f” |
3.14 |
“%.4f” |
3.1415 |
“%.2e” |
3.14e+00 |
“%.2g” |
3.14 |
“%d” |
3 |
Note
This function sets an attribute in a plotControl structure. It does not
affect an existing graph, or a new graph drawn using the default
settings that are accessible from the
menu.
See also
Functions dttostr(), strtodt(), plotSetXLabel(), plotSetXTicInterval(), plotSetTicLabelFont()