plotBox#
Purpose#
Graphs data using the box graph percentile method.
Format#
- plotBox([myPlot, ]group_id, y)#
- plotBox([myPlot, ]df_groups, y)
- plotBox([myPlot, ]df, formula)
- Parameters:
myPlot (struct) – Optional argument, a
plotControlstructuregroup_id (Mx1 vector or Mx1 string array) – This contains the group numbers or string labels corresponding to each column of y data. If scalar 0, a sequence from 1 to
cols(y)will be generated automatically for the x-axis.y (NxM matrix) – Each column represents the set of y values for an individual percentiles box symbol.
df_groups (Nx1 categorical dataframe variable) – A categorical dataframe vector. The y variable will be split by the categories in df_groups to create the boxes to graph.
df (dataframe) – name of the dataframe in memory.
formula (string) –
formula string of the model to be plotted. E.g
"y ~ X1",yis the name of dependent variable to be plotted on the y-axisX1is the names of the variable to be plotted on the x-axis;E.g
"y ~ X1 + by(X2)",by(X2)specifies that the data should be separated into different lines based on the groups defined byX2.
Examples#
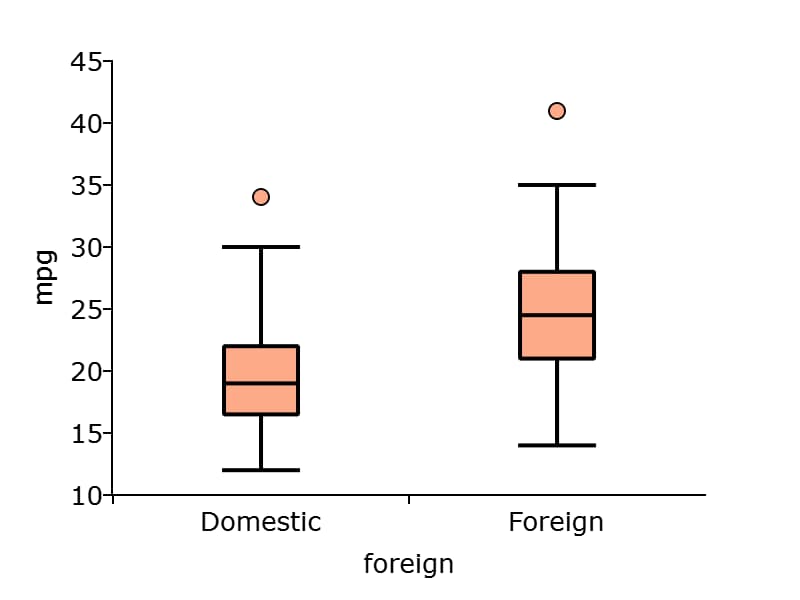
Dataframe with formula string#
// Import data
fname = getGAUSSHome("examples/auto2.dta");
auto2 = loadd(fname);

// Draw a box with 'mpg' data for each of
// the two categories in 'foreign'
plotBox(auto2, "mpg ~ foreign");
Dataframe with formula string#
// Import data
fname = getGAUSSHome("examples/tips2.dta");
tips = loadd(fname);

// Draw a box with 'tip' data for each day,
// split by whether 'smoker' equals yes or no.
plotBox(tips, "tip ~ day + by(smoker)");
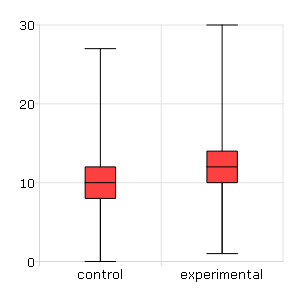
Matrix data with string labels#
// Create two columns of random data
nobs = 1e5;
y_1 = rndPoisson(nobs, 1, 10);
y_2 = rndPoisson(nobs, 1, 12);

// Create a 2x1 string array, using the
// horizontal string concatenation operator
labels = "control" $| "experimental";

// Draw the two boxes
plotBox(labels, y_1~y_2);
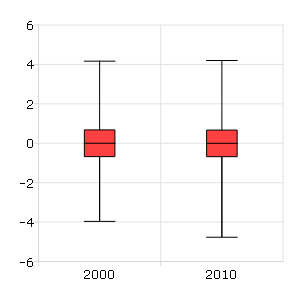
Matrix data with numeric labels#
// Create two columns of random data
nobs = 1e5;
y_1 = rndn(nobs, 1);
y_2 = rndn(nobs, 1);

// Create a 2x1 vector of numeric labels
labels = { 2000, 2010 };

// Draw the two boxes
plotBox(labels, y_1~y_2);
Remarks#
Note that numeric labels added to the x-axis are only labels for the corresponding boxes. They do not imply any order or denote a particular x-axis location.
If missing values are encountered in the y data, they will be ignored during calculations and will not be plotted.
See also
Functions plotHistP(), plotScatter()