plotSetBkdColor#
Purpose#
Sets the background color of a graph.
Format#
- plotSetBkdColor(&myPlot, color)#
- Parameters:
&myPlot (struct pointer) – A
plotControlstructure pointer.color (string) – name or rgb value of the new color.
Examples#
// Declare plotControl structure
struct plotControl myPlot;
// Initialize plotControl structure
myPlot = plotGetDefaults("polar");
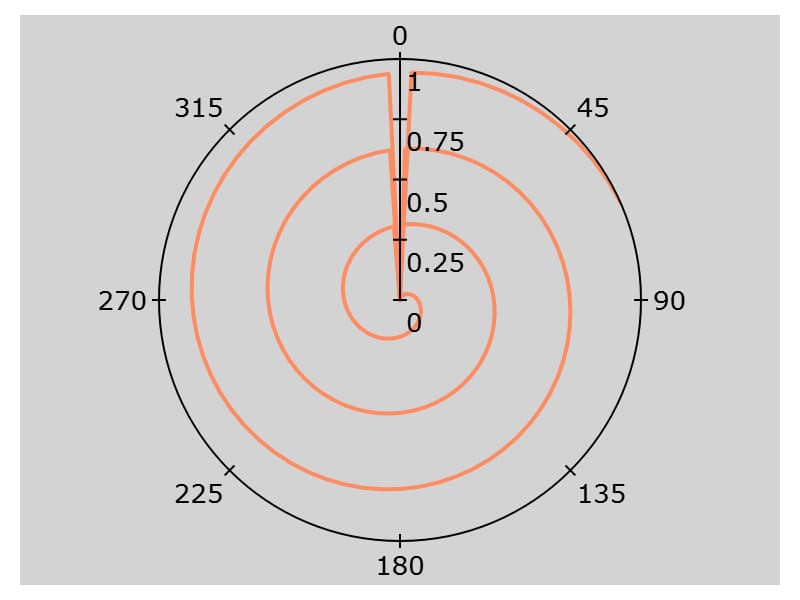
// Set new background color to light grey
plotSetBkdColor(&myPlot, "light grey");
// Create data
x = seqa(0.1, 0.1, 200);
y = x;
// Create a polar plot of the data with the new background
// color
plotPolar(myPlot, x, y);
Remarks#
Note
This function sets an attribute in a plotControl structure. It does not
affect an existing graph, or a new graph drawn using the default
settings that are accessible from the
menu.
See also
Functions plotGetDefaults(), plotSetLineColor(), plotSetLineSymbol()