plotAddBarH#
Purpose#
Adds horizontal bars to an existing graph.
Format#
- plotAddBarH([myPlot, ]val, ht)#
- Parameters:
myPlot (struct) – Optional argument. A
plotControlstructureval (Nx1 numeric vector or Nx1 string array) –
bar labels.
Scalar 0
The new bars will be added consecutively to the existing labels. See the example below.
Numeric
val represents the label indices.
String array
val represents labels and the bar is added to the existing matching label. If the label in val is not found on the existing graph, the label and associated bar is added to the end of the plot window.
ht (NxK numeric vector) –
bar heights.
K overlapping or side-by-side sets of N bars will be graphed.
Examples#
Example 1: Add bars to existing labels#
// Assign labels and bar heights
label = "alpha" $| "beta" $| "gamma";
ht = { 20, 40, 10 };

// Draw initial horizontal bar plot
plotBarH(label, ht);

// Add horizontal bars to the first two labels
ht2 = { 30, 50 };

// When the first input is 0, the new
// bars will be added to the existing bars
// consecutively.
plotAddBarH(0, ht2);
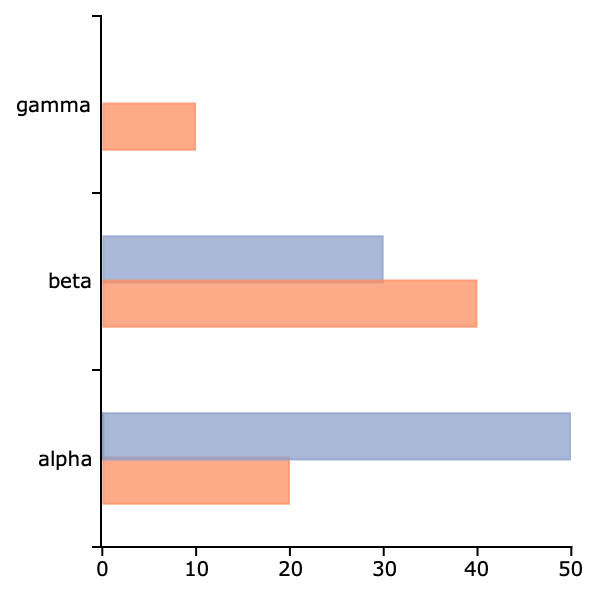
We could also create the same graph shown above, if we changed the zero passed to plotAddBarH() to a vector of indices like this:
indx = { 1, 2 };
plotAddBarH(indx, ht2);
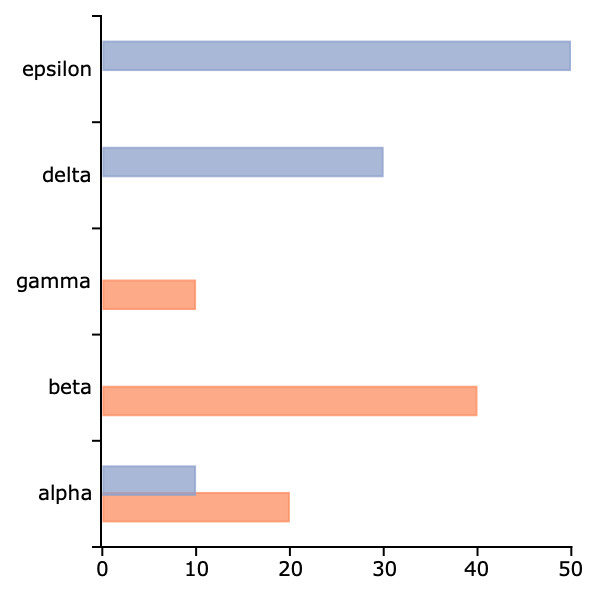
Example 2: Add bars to existing and new labels#
// Assign labels and bar heights
label = "alpha" $| "beta" $| "gamma";
ht = { 20, 40, 10 };

// Draw initial horizontal bar plot
plotBarH(label, ht);

// Add horizontal bars to the first label (alpha)
// and add two new labels (delta and epsilon)
ht2 = { 10, 30, 50 };
label_2 = "alpha" $| "delta" $| "epsilon";
plotAddBarH(label_2, ht2);
Remarks#
plotAddBarH() may only add bars to 2-D graphs.
This function will not change any of the current graph’s settings other than to resize the view as necessary to display the new curve.
See also
Functions plotAddBar(), plotAddHist(), plotAddHistP(), plotAddXY()