plotSetGridPen#
Purpose#
Controls the thickness, color, and style for the grid lines.
Format#
- plotSetGridPen(&myPlot, which_grid, thickness[, clr[, style]])#
- Parameters:
&myPlot (struct pointer) – A
plotControlstructure pointer.which_grid (string) – The grid to modify,
"major","minor", or"both".thickness (Scalar) – the thickness of the specified grid lines in pixels.
clr (string) – Optional argument, name or rgb value of the new color for the specified grid lines.
style (Scalar) –
the style of the pen. Options include:
1
solidSolid line.
2
dashDash line.
3
dotDot line.
4
dashdotDash-Dot line.
5
dashdotdotDash-Dot-Dot line.
Examples#
// Declare plotControl structure
struct plotControl myPlot;
// Initialize plotControl structure
myPlot = plotGetDefaults("xy");
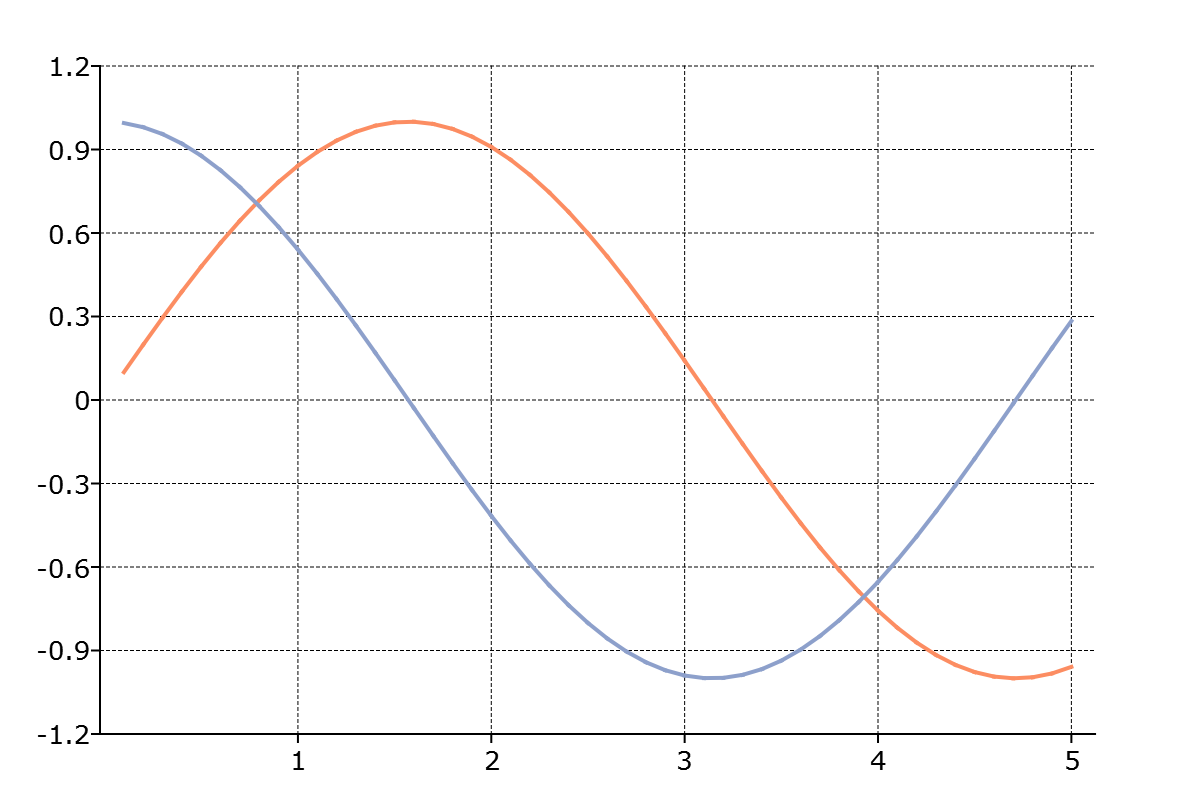
// Set the major grid lines to be 0.5 pixel wide, black, and dashed
plotSetGridPen(&myPlot, "major", 0.5, "black", 2);
// Create data
x = seqa(0.1, 0.1, 50);
y = sin(x)~cos(x);
// Plot the data with the new line colors
plotXY(myPlot, x, y);
Remarks#
The x-axis and y-axis grid line properties can be set separately with
plotSetXGridPen()andplotSetYGridPen().
Note
This function sets an attribute in a plotControl structure. It does not
affect an existing graph, or a new graph drawn using the default
settings that are accessible from the
menu.
See also
Functions plotGetDefaults(), plotSetLineSymbol(), plotSetXGridPen(), plotSetYGridPen()