plotAddHBar#
Purpose#
Adds one or more horizontal bars spanning the full extent of the y-axis to an existing graph.
Format#
- plotAddHBar([myPlot, ]y_start, y_end)#
- plotAddHBar([myPlot, ]y_loc)
- Parameters:
myPlot (struct) – Optional argument, an instance of a
plotControlstructure.y_start (scalar or Nx1 vector) – the Y coordinate for the start of the bounding box for each respective shape.
y_end (scalar or Nx1 vector) – the Y coordinate for the end of the bounding box for each respective shape.
y_loc (Nx2 vector) – the first column should contain Y coordinates. The second column should be a binary vector with a 1 for locations where the bar should be drawn, otherwise a 0.
Examples#
Add Horizontal Spanning Bar#
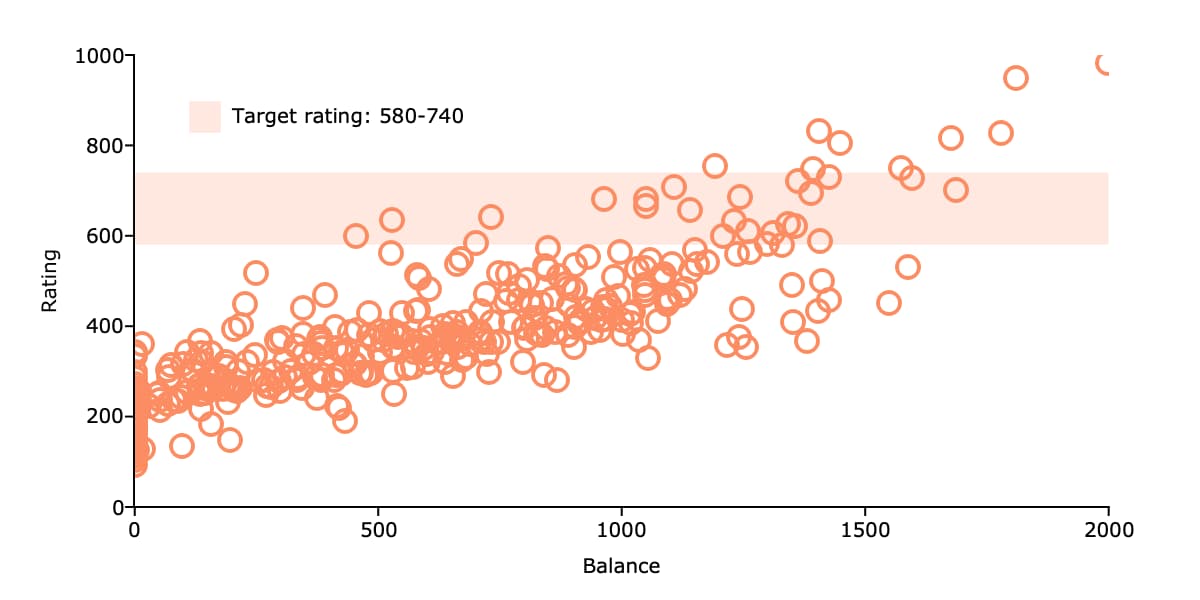
// Create string with fully pathed file name
fname = getGAUSSHome("examples/credit.dat");

// Load variables to plot from dataset
credit = loadd(fname, "Rating + Balance");

// Draw scatter plot
plotScatter(credit, "Rating ~ Balance");

// Declare plotControl structure and
// fill with default bar settings
struct plotControl plt;
plt = plotGetDefaults("bar");

// Solid fill with 20% opacity
plotSetFill(&plt, 1, 0.2);

plotSetLegend(&plt, "Target rating: 580-740", "top left inside");

// Add horizontal bar from y=580 to y=740
plotAddHBar(plt, 580, 740);
Remarks#
plotAddHBar() will add horizontal spanning bars to existing graphs. It will not create a
new graph, however, if one does not already exist.
plotAddHBar() is not yet supported for surface plots.
See also
Functions plotAddVBar(), plotAddHLine()