plotFreq#
Purpose#
Generate frequency plot of categorical data.
Format#
- plotFreq([myPlot, ]x, column[, sort, pct_axis])#
- Parameters:
myPlot (Struct) – Optional argument, a
plotControlstructure.x (NxK matrix) – data.
column (Scalar) – Categorical variable to be plotted.
sort – Optional, indicator to sort from most frequent to least frequent categories. Set to 1 to sort. Default = 0.
pct_axis – Optional, indicator to plot axis as percentage instead of counts. Set to 1 to plot percentages. Default = 0.
Examples#
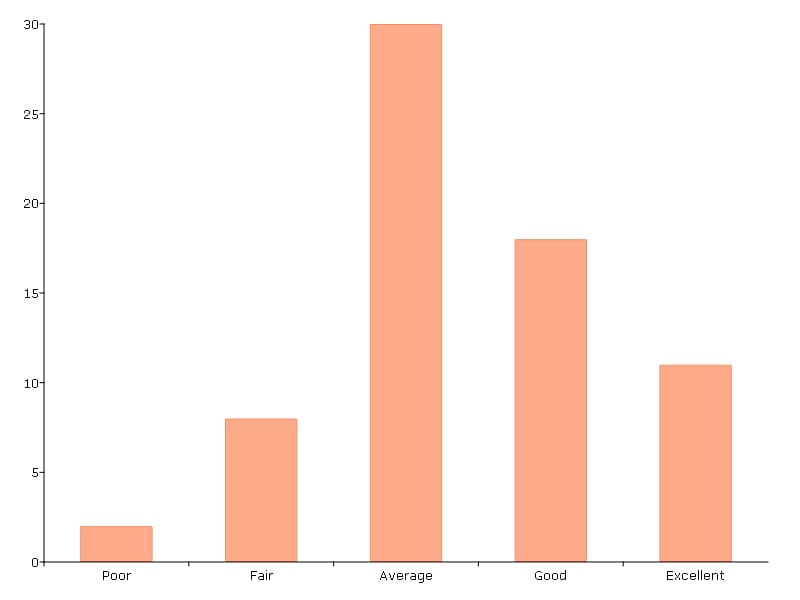
Example 1: Default settings#
// Load data
fname = getGAUSSHome("examples/auto2.dta");
auto2 = loadd(fname);

// Frequency plot
plotFreq(auto2, "rep78");
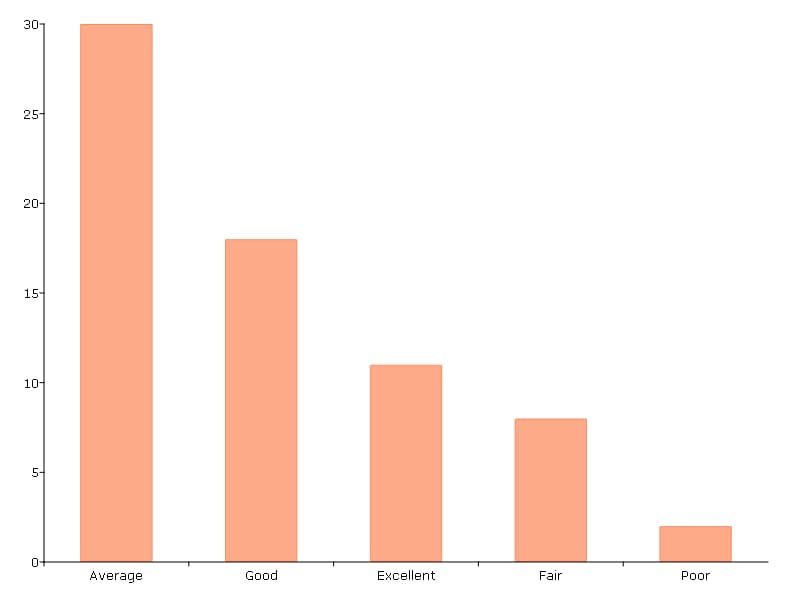
Example 2: Sorted bars#
To create a sorted table, use the optional sort input:
// Sorted frequency plot of 'rep78'
plotFreq(auto2, "rep78", 1);
Example 3: Plotting percentages#
To plot percentage frequencies, use the optional pct_axis input. Note that we must also include the optional sort input, since optional arguments must be specified in order:
// Unsorted, frequency percentage
// plot of 'rep78'
plotFreq(auto2, "rep78", 0, 1);

Example 4: Adding a title#
Any frequency plot can be customized using a plotControl structure:
// Declare plotControl structure
struct plotControl myPlt;
myPlt = plotGetDefaults("bar");

// Set title
plotSetTitle(&myPlt, "Frequency of `Rep78`");

// Frequency plot
plotFreq(myPlt, auto2, "rep78", 1);

Example 5: Plotting by group with ‘by’#
The plotFreq() function supports the use of the by keyword for plotting categorical frequencies by groups.
// Load dataset
tips2 = loadd("tips2.csv");

// Create a frequency plot of visits per day
// for each category of smoker (Yes, or No).
plotFreq(tips2, "day + by(smoker)");

See also
Functions plotHist(), plotHistP(), plotHistF()