plotSetXMinorTicCount#
Purpose#
Controls the number of minor ticks to place between major ticks on the x-axis of a 2-D plot.
Format#
- plotSetXMinorTicCount(&myPlot, num_tics)#
- Parameters:
&myPlot (struct pointer) – A
plotControlstructure pointer.num_tics (Scalar) – the number of minor ticks to place between major ticks on the x-axis.
Examples#
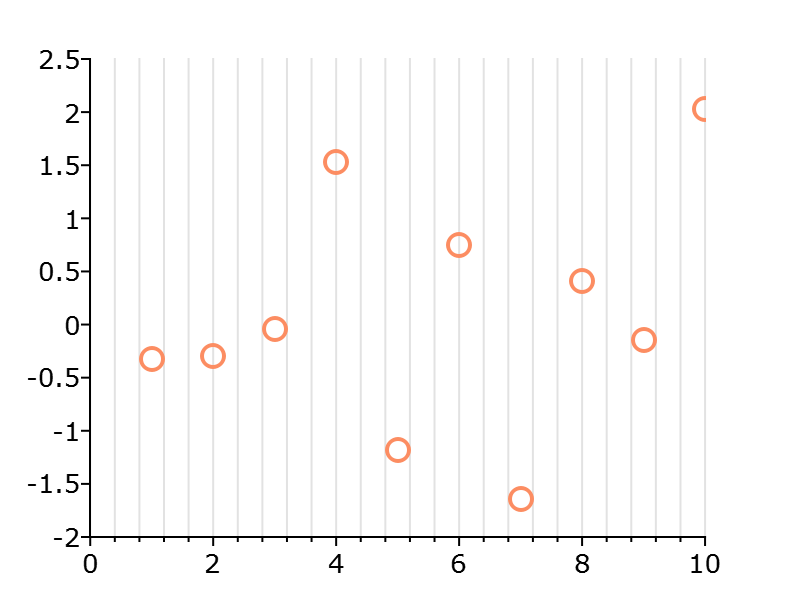
// Declare plotControl structure
struct plotControl myPlot;

// Initialize plotControl structure
myPlot = plotGetDefaults("scatter");

// Set x-axis major and minor grid lines on
plotSetXGrid(&myPlot, "both");

// Set x-axis minor grid lines tick count
plotSetXMinorTicCount(&myPlot, 4);

// Create a scatter plot of random data
plotScatter(myPlot, seqa(1, 1, 10 ), rndn(10, 1));
Remarks#
The x-axis minor grid must turned on using
plotSetXGrid()orplotSetGrid()for the minor axis to show.The x-axis minor grid is unsupported for bar, box, and histogram plots at this time.
Note
This function sets an attribute in a
plotControlstructure. It does not affect an existing graph, or a new graph drawn using the default settings that are accessible from the menu.See also
Functions
plotSetXGrid(),plotSetXGridPen(),plotSetXMinorGridPen(),plotSetYMinorTicCount()