plotSurface#
Purpose#
Graphs a 3-D surface.
Format#
- plotSurface([myPlot, ]x, y, z)#
- Parameters:
myPlot (struct) – Optional argument, a
plotControlstructure.x (1xK vector) – the x-axis data.
y (Nx1 vector) – the y-axis data.
z (NxK matrix) – the matrix of height data to be plotted.
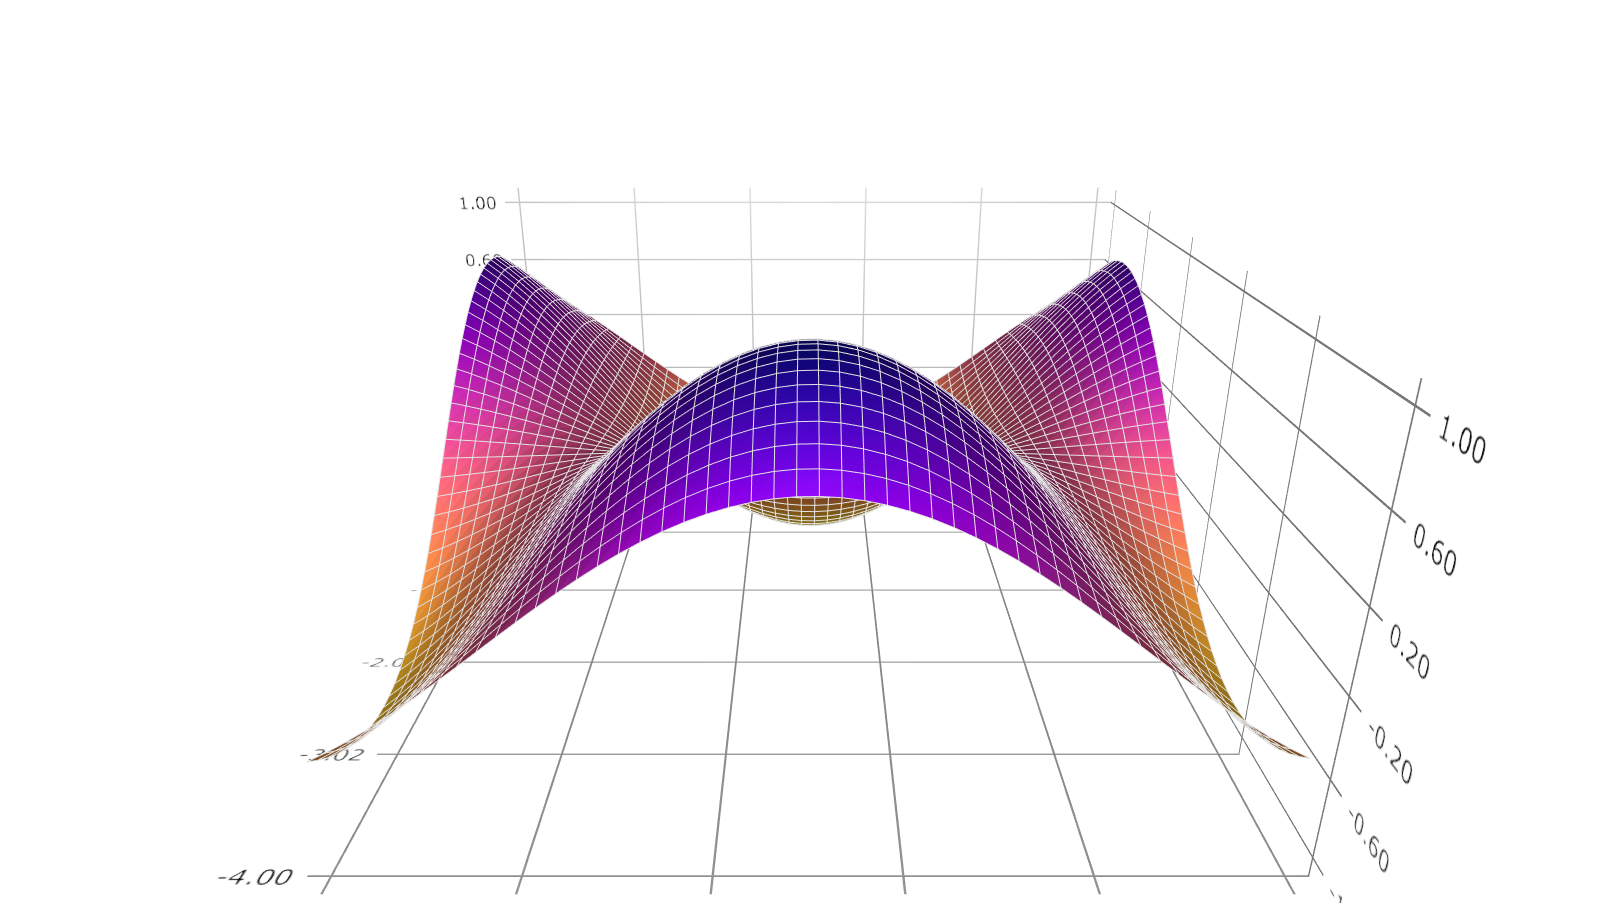
Examples#
// Clear out variables in GAUSS workspace
new;

// Create contour data
x = seqa(-4, 0.1, 50)';
y = x';
z = sin(y) .* cos(x) ;

// Set up control structure with defaults
// for surface plots
struct plotControl myPlot;
myPlot = plotGetDefaults("surface");

// Set color map
plotSetColormap(&myPlot, "plasma");

// Draw graph using plotcontrol structure
plotSurface(myPlot, x, y, z);
See also
Functions plotSetColorMap(), plotContour(), plotSetBkdColor()