plotSetYShow#
Purpose#
Hides or enables the display of the y-axis.
Format#
- plotSetYShow(&myPlot, is_on)#
- Parameters:
&myPlot (struct pointer) – A
plotControlstructure pointer.is_on (Scalar, or 2x1 matrix) – A 0 to hide the y-axis, or a 1 to show it.
Examples#
// Declare plotControl structure
struct plotControl myPlot;
// Initialize plotControl structure
myPlot = plotGetDefaults("xy");
// Turn off the left y-axis
plotSetYShow(&myPlot, 0);
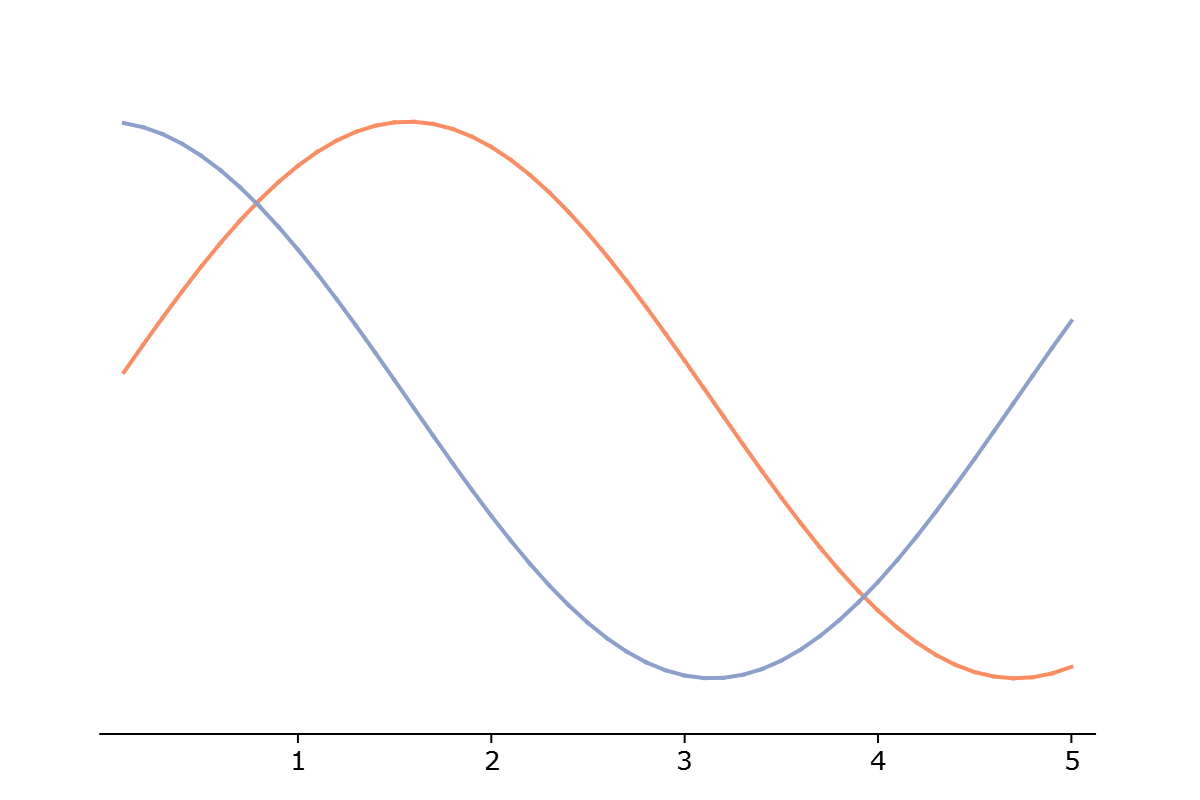
// Create data
x = seqa(0.1, 0.1, 50);
y = sin(x)~cos(x);
// Plot the data
plotXY(myPlot, x, y);
Remarks#
plotSetYShow()will not force an axis to be shown unless a series of data is attached to it. By default, data will be attached to the left y-axis. UseplotSetWhichYAxis()to control which y-axis a series of data is attached to.If
is_onis a scalar, it will apply to the left and left y-axes. If it is a 2x1 matrix, the first element will control the left y-axis and the second will control the right y-axis.
Note
This function sets an attribute in a plotControl structure. It does not
affect an existing graph, or a new graph drawn using the default
settings that are accessible from the
menu.
See also
Functions plotSetXShow(), plotSetYRange()