plotLR#
Purpose#
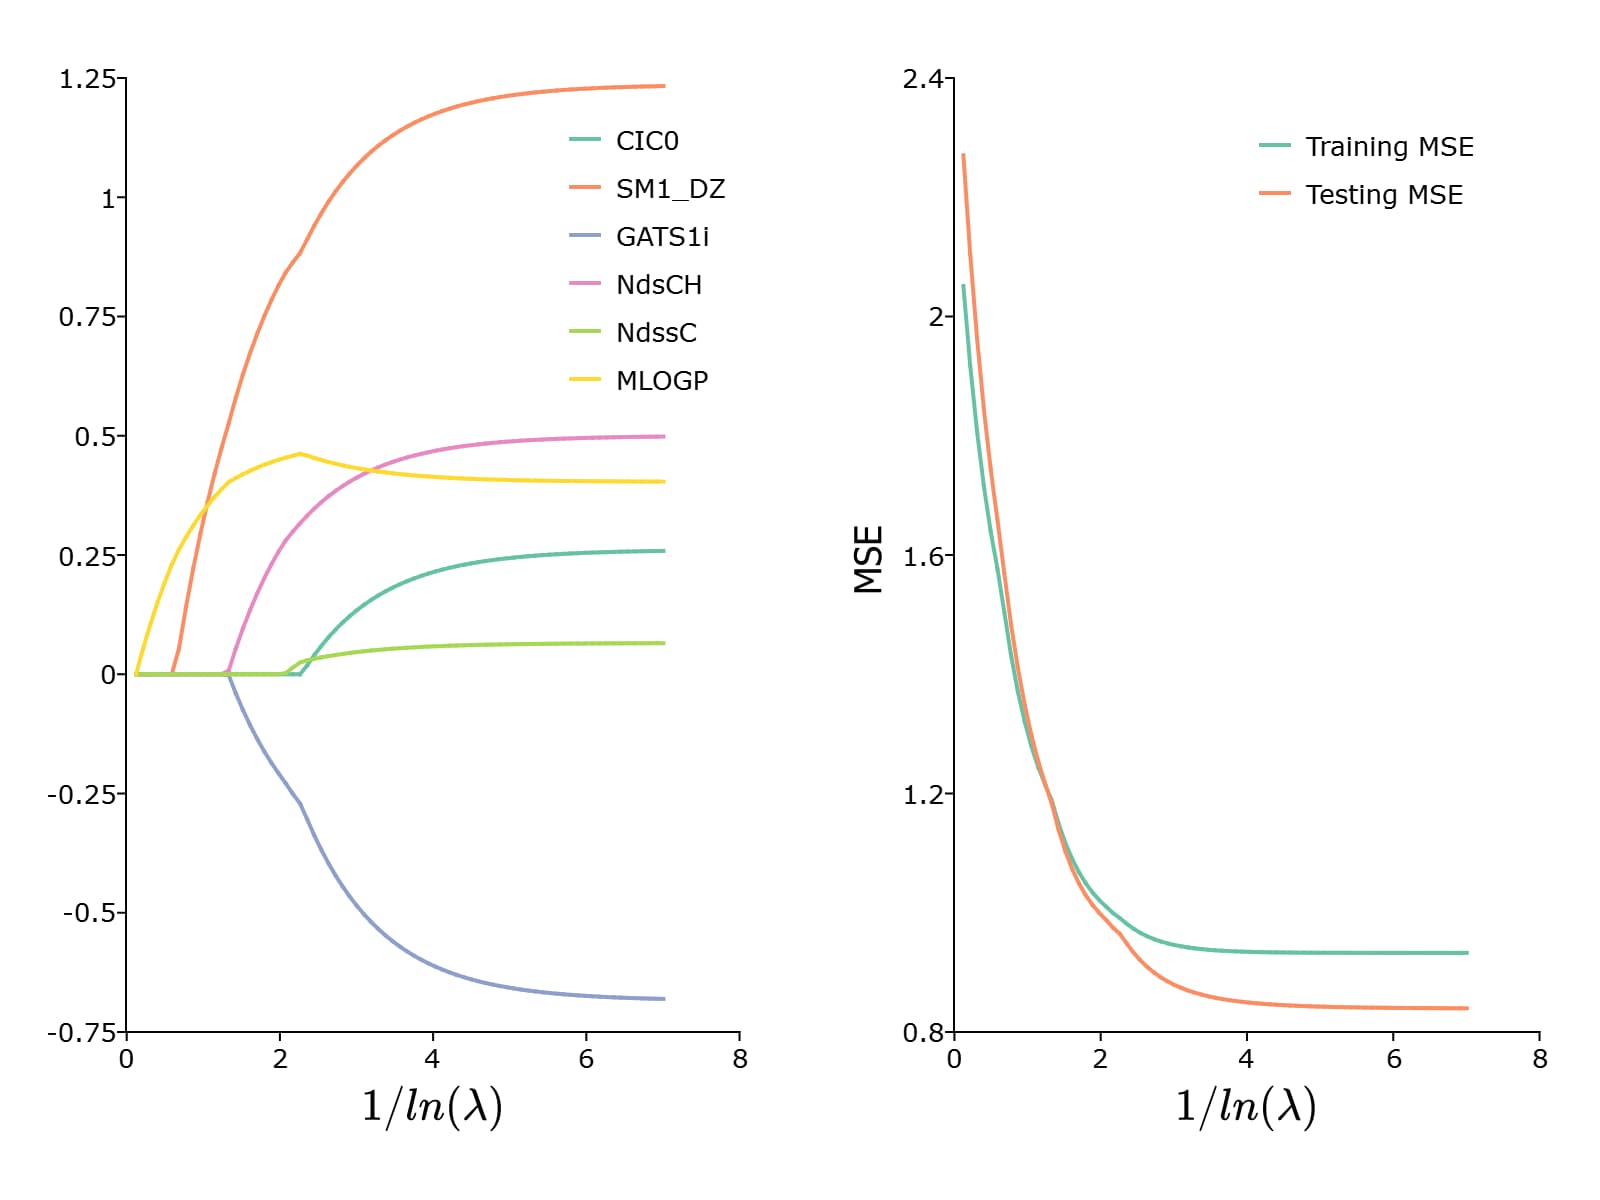
Generates summary plot of parameter path and mse path over lambda values.
Format#
- plotLR(mdl[, mse_test])#
- Parameters:
mdl (struct) – A filled instance of either a
lassoModelorridgeModelstructure.mse_test (Nx1 vector) – Optional, vector of MSE values for test data.
Examples#
new;
library gml;

// Specify dataset with full path
dataset = getGAUSSHome("pkgs/gml/examples/qsar_fish_toxicity.csv");

// Split data into training sets without shuffling
shuffle = "False";
{ y_train, y_test, X_train, X_test } = trainTestSplit(dataset, "LC50 ~ . ", 0.7, shuffle);

// Declare 'mdl' to be an instance of a
// lassoModel structure to hold the estimation results
struct lassoModel mdl;

// Estimate the model with default settings
mdl = lassoFit(y_train, X_train);

/*
** Prediction for test data
*/
y_hat = lmPredict(mdl, X_test);

test_mse = meanSquaredError(y_test, y_hat);

/*
** Plot results
*/
plotLR(mdl, test_mse);
This results in the following plot:
See also
Functions lmPredict(), lassoFit(), ridgeFit()