plotFreq#
Purpose#
Generate frequency plot of categorical data.
Format#
- plotFreq([myPlot, ]x, column[, sort])#
- Parameters:
myPlot (Struct) – Optional argument, a
plotControlstructure.x (NxK matrix) – data.
column (Scalar) – Categorical variable to be plotted.
sort – Optional, indicator to sort from most frequent to least frequent categories. Set to 1 to sort. Default = 0.
Examples#
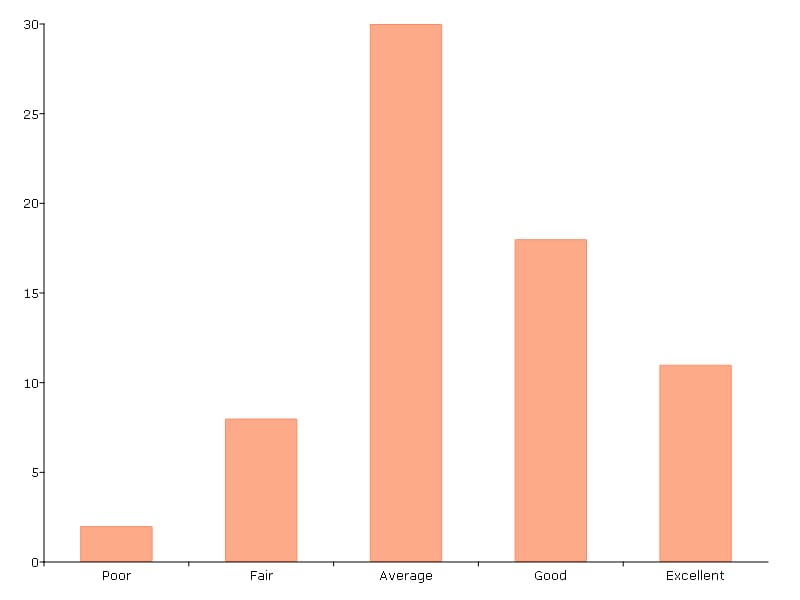
Example 1: Default settings#
// Load data
fname = getGAUSSHome("examples/auto2.dta");
auto2 = loadd(fname);

// Frequency plot
plotFreq(auto2, "rep78");
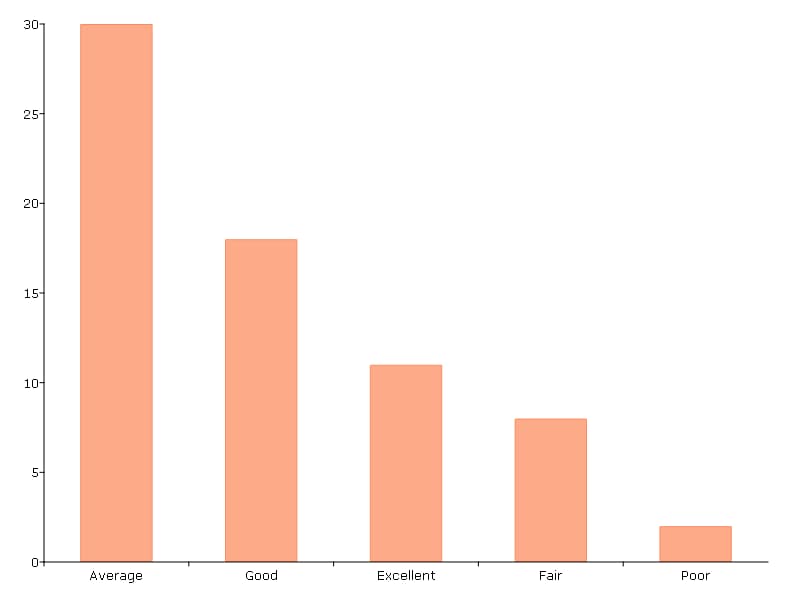
Example 2: Sorted bars#
To create a sorted table, use the optional sort input:
// Frequency plot
plotFreq(auto2, "rep78", 1);
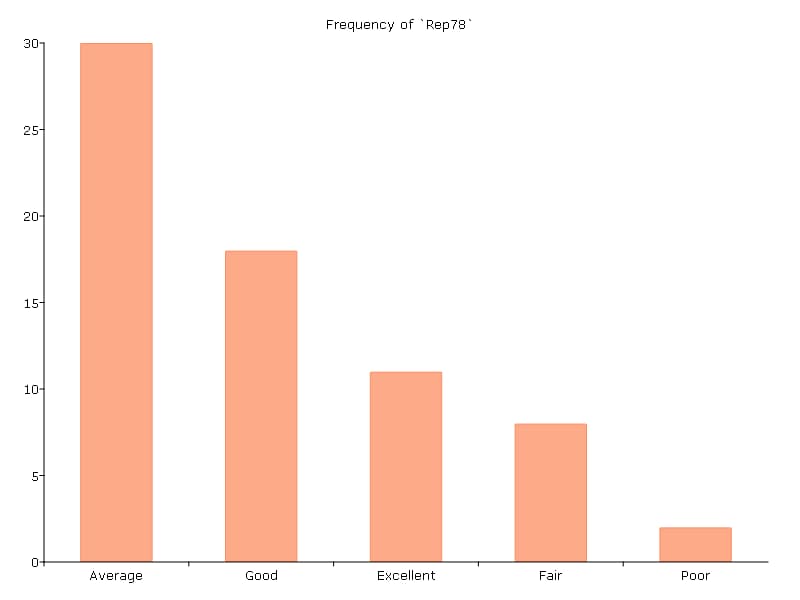
Example 3: Adding a title#
Any frequency plot can be customized using a plotControl structure:
// Declare plotControl structure
struct plotControl myPlt;
myPlt = plotGetDefaults("bar");

// Set title
plotSetTitle(&myPlt, "Frequency of `Rep78`");

// Frequency plot
plotFreq(myPlt, auto2, "rep78", 1);
See also
Functions plotHist(), plotHistP(), plotHistF()