plotSetGrid#
Purpose#
Controls the settings for the background grid of a plot.
Format#
- plotSetGrid(&myPlot, tickStyle[, color])#
- plotSetGrid(&myPlot, onOff)
- Parameters:
&myPlot (struct pointer) – A
plotControlstructure pointer.tickStyle (string) – specifies whether grid marks should be drawn on major tick marks. Options: [
"major","minor","both"].color (string) – Optional argument, name or rgb value of the new color.
onOff (string) – turns the grid on or off. Options: [
"on","off"]. If used, this must be the only argument passed to the function besides theplotControlstructure pointer.
Examples#
// Declare plotControl structure
struct plotControl myPlot;
// Initialize plotControl structure
myPlot = plotGetDefaults("scatter");
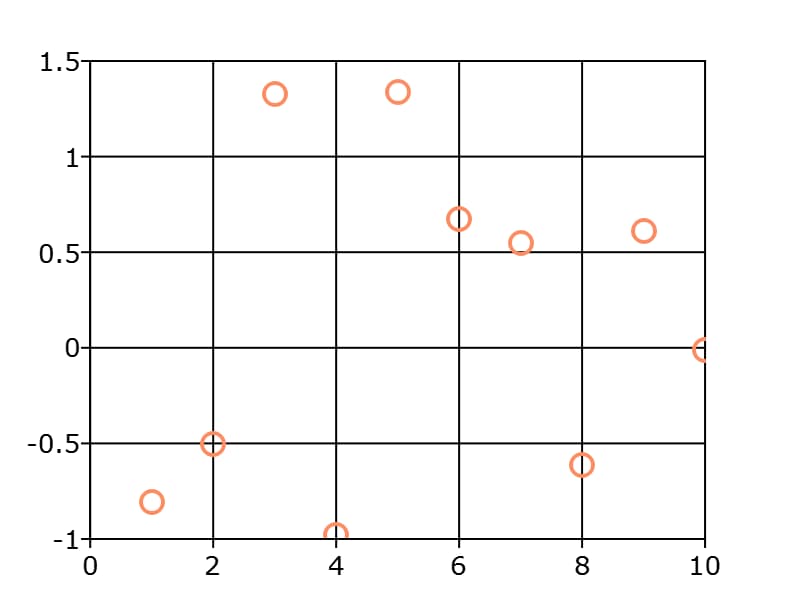
// Set grid to be black and on the major ticks only
plotSetGrid(&myPlot, "major", "black");
// Create a scatter plot of random data
plotScatter(myPlot, seqa(1, 1, 10 ), rndn(10, 1));
Remarks#
In most cases,
plotsetgridpen()is preferrred overplotsetgrid().
Note
This function sets an attribute in a plotControl structure. It does not
affect an existing graph, or a new graph drawn using the default
settings that are accessible from the
menu.
See also
Functions plotSetYGridPen(), plotSetXGridPen(), plotSetGridPen()